Your Questions
Some Questions
Here are some questions that you may encounter when you are writing your thesis, paper, or research proposal:
- “What should I put in my introduction section?”
- “How do I find a good research question?”
- “How can I demonstrate that my research is innovative?”
- “What’s the best way to find previous research?”
- “Can I just invent a hypothesis myself?”
- “How much detail should I give when describing the data I used?”
- “How many observations do I need for my data analysis?”
- “Should I write “I” or “we”, or write passive sentences?”
- “Isn’t my research a complete failure now my hypothesis was not supported?”
- “How should I organize my text?”
- “How should I respond to strong criticism?”
- “What should I put in my discussion section?”
- “How can I write a text from an outline?”
- “I’m stuck. Now what?”
You are not the only one to ask such questions. They come up every time I work with researchers and students. I encounter them as a supervisor of students in a variety of disciplines writing their Bachelor and Master Theses. Similar questions come up when new PhD candidates are writing up plans for their dissertation research, and when experienced researchers write grant applications. Below I will refer to ‘research’ in a generic sense. Depending on your objective, you can think of ‘my thesis’, ‘my paper’ or ‘my research proposal’.
Writing a thesis, a research proposal or a paper is a complex effort involving numerous decisions. I am writing this guide because you are not the only one with questions about these decisions. Despite the differences between social science disciplines and the specific traditions in these disciplines, I have found that students tend to come up with similar problems during their research projects. Moreover, the questions that emerge in writing an empirical journal article or a dissertation plan are similar. Another experience is that the solutions to these problems also tend to be similar. With this guide I hope to help you avoid these problems.
By describing the typical problems that students run into when writing their thesis and outlining their common solutions I hope you can save time, and end up with a better thesis. And I might save time in supervision. Please let me know whether it worked out at r.bekkers@vu.nl.
The examples I give here are mostly from research relying on survey data and experiments, because I have worked with these types of data in my own research. If you work with other types of data you may not find answers to your questions here. If you work on research questions outside the field of philanthropic studies, it will help you to replace the variables in the examples I give by the variables in your own research.
I thank successive cohorts of students I supervised since 2002, in writing their bachelor theses and master theses at Utrecht University and Vrije Universiteit (VU) Amsterdam. They provided many of the questions I discuss here.
Also this text would not have been possible without Twitter. I’ve learned so much from questions that students raised with tags like #phdlife and the responses by countless scholars.
I found additional inspiration in writing guides from economics, psychology, and the humanities. “How to write a thesis”, the classic advice to students in the humanities by Umberto Eco (2015), originally from 1977, is hilariously outdated in some respects because of the advance of technology, but it is still helpful in many other ways.
Teaching courses such as Proposal Writing, Research Designs in the Social Sciences, and Research Integrity and Responsible Scholarship in the Graduate School for the Social Sciences at VU Amsterdam forced and allowed me to think further about the questions. Supervising Arjen de Wit, Claire van Teunenbroek, and Tjeerd Piersma as PhD students provided further opportunities to develop the text. Finally, I thank Mark Ottoni-Wilhelm, Marieke Slootman, Boris Slijper and Rense Corten for helpful suggestions for the text to follow. The usual disclaimer applies: all errors are mine. If you find one, please let me know.
1. The Take Away
The three most important pieces of advice I can give to you are only one word: Focus, Focus, Focus. You want to finish in time and your supervisor also wants you to. The work you do for your research – gathering articles for your literature review, formulating additional hypotheses, robustness analyses, implications for theory and further research, the list grows longer and longer, you see I am losing focus here – all of the things you do in your research project hold temptations that make you lose focus.
Your focus is only one: to answer your research question. By working systematically towards that goal you save yourself a lot of trouble. It’s a little boring not to post status updates on Facebook or chat with your friends while you’re searching for articles or running regression analyses, but it works.
Start your day fresh. That means: before you start your work, close your e-mail program(s). Plan two limited periods of time to check messages. For instance half an hour after your lunch break, and fifteen minutes at 3 PM. Open and read only those messages that help you with your research work. Open only your text processor. Close all other programs. This also goes for your web browser. Only open tabs in your web browser that you really need for your research.
Put away your phone, and do not check messages on social media while you are at work.
When you’re at work, build in regular checks and ask yourself: is what I’m doing still relevant for the research question I’m trying to answer? How is it relevant? Why do I need to do what I’m doing right now? Depending on your distractibility level, ask yourself these questions once or twice a day, once every hour or perhaps every ten minutes. Whatever keeps you focused.
1.1. Plan ahead
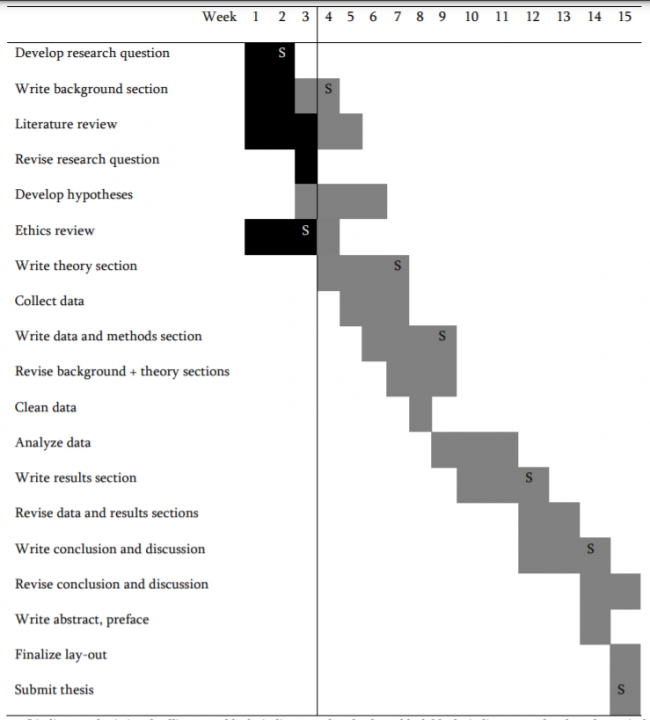
“If you fail to plain, you plan to fail” is a nice piece of advice on project management that you can use in your own research project. A GANNT chart (not an acronym but named after Henry Gannt), helps you plan your work. You can use the example below as a template, and modify it to your situation. The chart is based on a typical master thesis. Obviously you will need more time for a dissertation.
- Start with a list of tasks that you will need to complete for your research. The example below includes only the most common elements of a single study. A pilot survey or experiment is not included. Also note that the schedule does not include a break.
- For each task, estimate how much time you will need to complete it. Add time for potential delays. Remember Hofstadter’s law: It always takes longer than you expect, even when you take into account Hofstadter's Law (Hofstadter, 1999, p. 152).
Figure 1. Gannt chart template. Notes: S indicates submission deadline; grey blocks indicate work to be done, black blocks indicate completed work; vertical line indicates TODAY.
- If you are collecting new data yourself, calculate a delay for this task. Data collection typically takes longer than you would expect. If you are planning to conduct personal interviews, plan more time than you would think is required to line up people. Also come up with a plan B – what you will do if your research strategy fails.
- Order the tasks chronologically. In a given week, you may work at several tasks.
- Also indicate deadlines: in the chart five submission dates (marked with an S) are included.
When you start your day, look at the chart and see whether you are still on schedule. You can color the bars differently to indicate your progress. In the example, completed tasks are colored black. The vertical line indicates TODAY. At the end of week 3, the student in the example has submitted her research question to her supervisor and revised it in response to the feedback she has received; she has written about half of her background section – the arguments about societal relevance do not yet form a tightly written paragraph and the scientific relevance paragraph is still missing; she is about halfway with her literature review; and finally, she has not yet begun to formulate hypotheses. You can see a small delay here. It is wise to plan some time for potential delays.
Keeping track of your progress will help you recognize delays early on, so you can adapt your schedule if necessary, and inform your supervisor that you will not be able to make a deadline. At this stage, the delay is not a cause for much concern.
1.2. Work in the right order
The order of tasks in the Gannt chart has a logic to it: it follows the cycle of empirical research. The empirical cycle consists of five elements: 1. Background; 2. Question; 3. Theory; 4. Research; 5. Conclusions. Despite its second place in the order of things, the question you are answering is the most important of the five elements. Your research answers a research question that emerges from a background of societal issues and previous research, develops ideas that could be the answer to your question, and presents data analyses that are relevant for this question. Furthermore, your research will contribute new insights to revise theories that answer the question and to design policies that change the reality that formed the background to your question. At that point, the cycle has completed one round. The changed reality, in turn, may form the background of future research.
While your research may include additional elements, it should include at least the following, in this order:
- Formulate an initial version of your research question (see paragraph 2.2).
- Then start gathering previous research and read it. Identify the state of the art in the literature on your research problem (see paragraph 3.4).
- Having identified the gaps in the literature, reformulate your research question and present this to your supervisor, asking for feedback (see section 1.4).
- Write a first draft of the introduction (see chapter 2), describing the research question, the relevance of your study, and a very brief description of the research design.
- Determine whether an ethics review is required for your research, and if so, apply.
- Next, formulate hypotheses (see paragraph 3.5) and design your research (see chapter 4).
- Collect data, analyze them and describe the results (see chapter 5).
- Write the conclusion and discussion (see chapter 6).
- Write the summary or abstract (see chapter 7).
- Finally, write the preface (see chapter 8) and lay-out your document (see chapter 10).
- Check-check: go over your text and correct errors.
- Check-check double-check: let someone else go over your text and suggest improvements.
1.3. Before you start writing
Good writing is an exercise in perspective taking. Before you start writing, first determine which audience you are addressing. Are you writing for a highly specialized professional audience of academics? In which discipline do these academics work? Or will you be writing for a lay audience? Next, imagine what your readers know about your research question, about previous research, and especially what they do not know. Are the concepts you are using familiar? Explain a new or potentially controversial concept or definition the first time you use it in your text. Do not argue about controversial concepts before you have defined them. Use the conventional jargon in the field to which you are contributing.
1.4. The goal
Your goal is to write a valuable contribution to the scientific record. Research is more valuable when:
- You answer an intriguing, relevant and timely research question;
- You develop a set of theoretically grounded hypotheses;
- You thoroughly test these hypotheses;
- You suggest guidelines and actions for policy and practice.
1.5. Ask for feedback
Always ask for feedback on your ideas and on your writing. Comments and suggestions will help you improve your ideas and your writing. Whatever you have thought out or written, it will never be perfect the first time. This is not a failure. Even the best researchers and most brilliant minds and writers have numerous versions of their works. Everyone in academia I know has documents titled ‘final.doc’, ‘final_revised.doc’ and ‘final_rerevised.doc’ and files with extensions _v023 in their folders. Rewriting is not a sign of failure – in contrast, giving your draft to somebody else is a practice of good scholarship. Someone who does not respond well to criticism does not belong in academia.
Ask someone who is prepared to give you an honest opinion on your work. You cannot improve your work if you only get compliments and qualifications like ‘well done’. Also ask for actionable advice. Constructive feedback is more than highlighting paragraphs and adding comments such as ‘unclear’ or ‘?’.
When you ask your supervisor for help, don't say "I do not understand this" or “I do not know what to do”. Instead, explain your understanding and describe what you think you should do next, and ask what your supervisor thinks about it. Usually when you feel you are stuck you have multiple possibilities in your mind, and are just not sure which one is correct. In my experience, however, in most cases your intuition is correct, and your supervisor will confirm your hunch.
The earlier you ask for feedback, the more helpful it will be to you. I say this because it is my experience that some students would rather present a near-final text than a very rough draft. This causes students to delay asking for feedback, while the only changes that they made in the most recent revisions were stylistic additions that did not improve the contents but merely the lay-out. If you delay asking for feedback, you will only reduce the time you have left to do anything with the feedback once you receive it.
1.6. When you get stuck
Academic writing can be frustrating and tiresome. There will be times when you don’t see a good way forward or when things are just not moving ahead. This is normal. Most of your fellow students have the same experience. Your predecessors have had it. Even your teachers and established professors know what it’s like to get stuck at some point. This means that it is not your fault, and that it is a natural phenomenon.
There are some things though that you can do to get going again. Take a break, get outside. Take a walk and get some fresh air. Most people become less productive after working 15-20 minutes on the same task.
If you have trouble getting your thoughts straight, try to talk to friends about them. You will find yourself using different words, and avoid technical terms. This will force you to keep things simple and get to the core.
Perhaps you will find out that your thoughts are not yet clear. If you can’t explain your thoughts in simple terms you probably have not yet mastered them. When you have to explain your thoughts to others, they will find missing pieces in your arguments. This may work even when there’s no one around. Imagine you are talking to a friend, and explain your thoughts in a voice recording. Write up what you’ve said and revise.
You may also get stuck because you think the quality of your writing is not up to a certain standard. If you have trouble getting the words right, lower your standards for a first draft. You can always improve the writing later – as long as the main thoughts are there, you will have achieved something. The draft is good enough to discuss with your supervisor.
When you continue to have trouble organizing your thoughts, consider working with an outline. Chapter 11 explains how you can do that.
1.7. After writing
Use the checklist below to see whether your report includes the most important ingredients. Did you include all the elements in the checklist? If you write a research proposal, you will not have results yet. But you can still discuss what the implications are of the results you expect to find.
Checklist for an empirical research report
I&I – Interest & Innovation
Make your research interesting and demonstrate innovation in its:
- Societal Relevance
- Scientific Relevance
RQ – Research Question
Identify your:
- X – Independent Variable
- Y – Dependent Variable
- Med – Mediating Variable
- Mod – Moderator
TH – Theory and Hypotheses
For each hypothesis, discuss its
- Prediction: the result you expect to find
- Foundation: the theory it is based on
- Support base: results of previous tests
ACT – Levels of Variance
Identify the
RD – Research Design
Strive for the best possible
- Data
- Causal Inference Strategy
R&C – Results & Conclusion
Discuss your
- Answers to your research questions
- Results of hypotheses tests
- Study limitations
- Implications for theory and future research
- Recommendations for policy and practice
|
2. Writing the introduction
2.1. What should I put in my introduction?
The introduction includes at least the following elements:
- The research question you will answer.
- Arguments about relevance: why it is important to know the answer to the research question.
- Some historical and local context for your research.
- A literature review, summarizing the key theories or hypotheses that could help answer the question, and an assessment of previous research.
- Your contribution to the theory, research methods and body of evidence.
In some disciplines such as economics it is common to include the findings in the introduction, while this is not common in other disciplines. Also disciplines vary in the amount of attention you need to devote to the context, theory, and research design. See chapter 9: “When in Rome, do as the Romans do”.
The research question. The first substantial piece of your research is the introduction in which you formulate your research question, and convince the reader that it is important to read further to get the answer. Make sure you do both as early as possible. So: start the introduction with a very brief formulation of your research question. This enables the reader to understand what the remainder of your text is about. Make it a habit to start writing by formulating a question. As you can see I’ve taken this advice to heart by formulating section titles in the form of questions.
Relevance. To convince people why they should be interested in your research, you need two types of arguments: arguments about the societal relevance and arguments about the scientific relevance. The question you should answer before you write the paragraph about the societal relevance is: who will be interested in your research outside academia, and why? The question you should answer in the paragraph about the scientific relevance is why people in academia should be interested in your research. I will talk about the scientific and societal relevance later in two separate paragraphs (2.3 and 2.4).
Context. Describe the context of your research problem for the period covered by your empirical data. The further history may be interesting in its own right, but describe it only if it has consequences for your hypotheses or findings.
Literature review. The literature review starts with a fact finding mission: what are the most important concepts and definitions and how are they connected? How have these concepts been operationalized in previous research? Which theories and hypotheses have been offered in previous research to examine the relationships between concepts? What does the evidence say about these relationships? What have we learned from these studies with respect to the validity of theoretical expectations – if any?
Next comes a critical assessment of these studies: the conceptual confusion in definitions, the lack of clear hypotheses, the inconclusive research designs, the light weight of the evidence, the selective presentation of findings to ‘support the expectations’. The modal answer in the social sciences to a question like ‘what do we know about X’ is that we know very little with certainty.
Contribution. The introduction should identify the research gaps in the literature. Position the empirical work that follows the introduction – i.e. the analyses in your thesis, the chapters in your dissertation – as an attempt to fill some of these gaps. Tie the contribution to the arguments about relevance: how does your study contribute to science and society?
Do not put an ‘empty roadmap’ in your introduction (Cochrane, 2005; Sociomama, 2018). Nobody wants to read sentences like “In the introduction, I will introduce the topic” or “In the discussion I discuss the conclusions”. There is no additional value in warning the reader that after the introduction, you will discuss theories and review literature, before you present the data and methods, the results, and the conclusion and discussion. This structure is self-evident. Even when your piece has an unusual structure, there is no value in a section, paragraph or even a sentence explaining the structure of the remaining text. Readers recognize the structure from the section titles of the paper and the table of contents.
2.2. How can I come up with a good research question?
A very common issue at the beginning of research projects among many students, PhD candidates Early Career Researchers (ECRs) and even among senior academics is uncertainty about the question that the project should answer.
A good research question addresses an important problem, the answer to which contributes to both societal needs and to science. Your contribution to science and society should answer a question that is both unresolved and important. It should be a question that we do not yet have the answer to or an incorrect answer, and it should be a question that matters. We will get to the societal and scientific relevance in sections 2.4 and 2.5 below.
Your research question should be an interesting question. That is: the answer should be relevant for yourself, for society as well as for science.
It is important that you are personally intrigued by the question you are asking, because you will devote a substantial amount of time to your research. You better work on something you find interesting. One way to avoid getting bored is by asking a question that is relevant to you personally. This will keep you motivated when you get a lot of feedback, when you are waiting for your data to come in, or when have to engage in repetitious work to prepare the analyses.
How then do you find your question? Start by reading literature recommended to you by your supervisor. As you are reading these materials, see which of these spark your interest. If your supervisor has not yet provided a review article that presents the state of the art on the topic, try to find it. Section 3.4.2 provides suggestions that help you find such an article. Research reports and review articles often end with suggestions for future research. Which of these questions are most appealing to you? Which questions do you think are most relevant for science and society?
Next, draft your research question using the suggestions below. Write down the reasons why you find the question important for science and society. Don’t worry if you find it difficult to do this. Talk about your motivation with friends, not only to see whether they find the question important, but also to see whether you are able to make the case. If you can’t explain why it is an important question, it may not be an important question, or you have not mastered it yet. Through further discussions you discover which arguments are convincing. Revise the question using the feedback you get.
Finally, send your revised research question to your supervisor. Be prepared to revise the text. Don’t be disappointed by the comments and suggestions that you will undoubtedly get – they do not mean that you have not thought it through or that you are on the wrong track. It is simply your supervisor’s role to improve your research ideas.
2.3. How should I construct my research questions?
- “What is a good research question?”
In addition to the substance of your research questions, the way you formulate them is an important feature that determines the success of your research. Broadly speaking, there are three types of research questions (Ultee, Arts & Flap, 2009):
- Descriptive questions;
- Explanatory questions;
- Policy questions.
A descriptive question asks for a description of a phenomenon, about its development over time, or how it varies between persons, contexts. Descriptive questions invite readers to go on a discovery mission: “let’s see what the world looks like!”
An explanatory question asks about causes of the phenomenon you are interested in. Explanatory questions invite readers to delve deeper into things they already know: “let’s find out why the world looks the way it does!”
Finally, a policy question asks about ways to change the world in a desired direction. Policy questions invite readers to solve problems or avoid them: “let’s fix this!”
2.3.1. Work in the right order
Before you pose a research question, make sure that it is a question to which we do not yet know the answer. You do not want to present a research question without having read previous research. In all likelihood, the question has been asked and answered by others before you. Make sure you have read previous research on your research question. See section 3.4 below for suggestions on how to select relevant research.
Again, also in the formulation of research questions keep in mind to work in the right order (Ultee, Arts & Flap, 2009). The three types of questions can be ordered in the form of a pyramid. Explanatory questions build on descriptive questions; policy questions build on explanatory questions. Descriptive questions are the most basic type of questions, that have to be answered before explanatory questions can be answered. Policy questions, in turn, presuppose that the answer to a set of explanatory questions is known. You can see that policy questions are the most difficult to answer because they require both valid answers to descriptive as well as explanatory questions.
An example serves to illustrate this cascade of questions. Suppose your research question is: “To what extent can differences in volunteering between religious groups be explained by differences in altruistic values and being asked?” This example follows from a study (Bekkers & Schuyt, 2008) that we will discuss in more detail below (see section 3.1).
This research question presupposes that you know the answer to the following descriptive research questions:
- “What is the proportion of the Dutch population engaged in volunteering in 2018?”
- “How does the proportion of volunteers differ between religious groups in the Netherlands in 2018?”
The explanatory research question in this example is: “How can differences between religious groups in the proportion of volunteers in the Netherlands in 2018 be explained?”
When you ask an explanatory research question, make sure that the assumptions are correct. The explanatory research question in the example assumes that there are differences between religious groups in the proportion of volunteers in the Netherlands in 2018. Check this. If there are no such differences, and all groups have about equal percentages of volunteers, your explanatory question is misguided. You cannot answer it in a meaningful way.
Reading previous research, you may get the impression that the relations that you are interested in have changed over time. In this case, it may be interesting to ask the following set of questions:
- “How has the proportion of volunteers in religious groups changed since 1998?”
- “How can changes in volunteering by religious groups be explained?”
This second set of questions follows the first set of questions. For a thesis, I would not recommend you to try to answer these four questions, but only two. I have numbered them consecutively, but you could answer questions 3 and 4 in a thesis without answering questions 1 and 2. In a dissertation, questions 1 and 2 would be good for one chapter, and 3 and 4 for a second chapter.
The above examples follow two rules for research questions:
- Work in the right order: first ask descriptive questions (which may concern a certain point in time or a change over time), then explanatory questions, and finally policy questions;
- Ask a question about mediation: ‘how can the influence of X on Y be explained?’ and/or moderation: ‘under which conditions does X influence Y?’.
2.3.2. How to formulate a research question
- “How should I formulate my research question?”
It is not easy to formulate your research question. Unless you are a genius – and you might just be one, so please go ahead and try – it is rather unlikely that the first attempt to formulate your research question is perfect. This goes for any piece of writing you do and submit to your supervisor, by the way. The first version is hardly ever going to be perfect. You should expect comments and suggestions. They are a good thing: they will make your work better. Constructive criticism is the engine of all progress in science. It’s your task to make good use of the suggestions you get.
Below I discuss twelve common problems in the formulation of research questions, using actual examples I have encountered in the past. For each example, I suggest a solution.
1. Identifying a topic, but not asking a question
If you write a sentence like ‘This research deals with aspects of Corporate Social Responsibility’ or ‘In this paper, I explore Corporate Social Responsibility from the perspective of theories on communication’ you do not ask a question. It is better to have a specific question than to have a broad topic (Eidlin, 2011). The problem with not asking a question is that you do not force yourself to say what you are really trying to research and create too much room for diversions and side tracks. A lack of focus is not merely a problem for yourself, but also for readers like your supervisor.
The solution to this problem is to think in terms of questions, and also write in terms of questions. It may seem obvious, but a research question is literally a sentence that ends with a question mark (“?”).
A good research question starts with words like ‘How…’ or ‘To what extent…’ or ‘Why…’. For descriptive research questions, start with ‘How…’ or ‘To what extent…’. For explanatory questions, use ‘Why…’. When you know that you are interested in a certain topic, try to formulate a question about it that starts with these words.
This strategy does not always work. You may conclude that you need to think and read more before you are ready to formulate your research question. For instance, if you try to rephrase the examples above in terms of questions you will see that you do not get very far. Saying that you deal with ‘aspects of CSR’ is a way of saying you are not sure what your question is. Which aspects are important? A better example would be: ‘How do corporations decide how much to invest in a CSR strategy?’ or ‘Why do some corporations invest more in CSR than others?’ or even better: ‘How can differences between corporations in CSR strategies and investments be explained?’
2. Asking a definitional question
The question ‘What is altruism?’ is fascinating from many points of view and has puzzled numerous philosophers and researchers throughout history. It is a very complicated and challenging question. In fact, it is a question that exceeds the scope of your project. Also, it is a question that you cannot answer with new empirical research.
The solution to this problem is not to ask a definitional question in your text. This is not to say that you should not ask definitional questions, or that they are meaningless. Of course you need to know what you mean by the concepts you use. Also you need to make sure that the reader knows the meaning of the concepts you use. Imagine you are a zoo keeper describing a rare species that you happen to have but that is hiding from visitors. You want your visitors to recognize the animal when it exposes itself. If you use a concept that is not common knowledge, explain its meaning the first time you use it. Just take the most common definition from the literature. If there is controversy in the literature about the definition of concepts that are important for your research, you can acknowledge alternative definitions in a footnote. But do not bother the reader with discussions about words when they do not have consequences for your hypotheses.
3. Asking a meta question
The question ‘How has altruism been explained in previous research?’ is an example of a meta question. The meta question may be useful for you to answer when you are trying to get an overview of the literature. It could even be the perfect question to pose when you are writing a literature review. However, it is not a useful question for your empirical research.
The solution to this problem is to find the substantial questions that are hidden in the meta question. In this case an interesting (but very broad and difficult) question is ‘How can altruism be explained?’ You should ask a substantial question instead of a meta question.
4. Asking a yes or no question
An example of a ‘yes or no’ question is: ‘Does empathy influence altruistic behavior?’ This is an explanatory ‘Does X influence Y’ question. In the social sciences, it is hard to find either/or phenomena, like a light switch or an on/off button. Some things are either black or white, but most things are in shades of grey. Yes/no questions are crude and yield less informative answers than more refined questions. It is better to ask the more refined questions right away. You want your research to be as informative as possible. After all, the goal of science is to learn, not to be right.
The solution to the problem of asking a ‘yes/no’ question is to rephrase it in terms of a ‘to what extent’ question or in terms of a conditional question. ‘Yes/no’ questions are encompassed in ‘To what extent’ questions. So instead of the question ‘Does empathy influence altruistic behavior?’ it is better to ask: ‘To what extent is altruistic behavior motivated by empathy?’ If the answer to your initial yes/no question is positive, and altruistic behavior is indeed motivated by empathy, the follow-up questions are going to be: “How strong is the influence?”, “How does the influence work?”, “For whom is the influence stronger?” and “In which circumstances is the influence weaker?”.
Also, in almost all ‘Does X influence Y?’ questions there will be evidence from previous research that already shows some relationship. Typically, the research is less clear on how the relationship can be explained, how the relationship varies from one person to another, or how the strength of the relationship may depend on characteristics of the situation. Your study is more relevant if it asks a more refined follow-up question to which the answer is not yet known, such as ‘In which circumstances is altruistic behavior more strongly motivated by empathic concern?’
5. Asking a black and white question
‘Is altruistic behavior determined by altruism or egoism?’ This type of question is different from the yes/no question because it suggests two positive alternatives. However, it suffers from the same problem because it assumes that the world is black and white: the motivation is either altruism, or egoism. In reality, people will be motivated by both altruism and egoism.
The solution to the black and white question is the same as the solution to the yes/no question: ask a ‘To what extent?’ question instead. The answer could be: ‘mostly by egoism’, ‘almost entirely by egoism’, or even in terms of a percentage: ‘for 95% by egoism’. In theory, the answer could be ‘entirely by egoism’. Only in that unlikely case, it would have been meaningful to ask a yes/no question.
6. Including incorrect assumptions
The question “Why are women more generous than men?” assumes that women are more generous than men. Though in some contexts this assumption may be true, in others it may be incorrect (for a review, see Wiepking & Bekkers, 2012). Findings reported in the literature may not hold in other contexts. Check the assumptions in the question you ask.
7. Omitting time and place
By including the time and place of your research, you situate the findings in a specific context. Omitting time and place suggests you will give a timeless answer to a question that is valid irrespective of the context of your study. It is very hard to uncover universal truths about the essentials of human nature by conducting an experiment among one hundred of your fellow students at your university or even by analyzing survey data about one hundred thousand citizens across the world.
The solution is obvious: specify the time and the place for the phenomena that you are exploring and trying to explain. Note that this solution may go against the advice that questions should be as informative as possible.
8. Leaving the comparison implicit
When you ask a question that involves a comparison, make it explicit. The fact that annual levels of giving to charity by high incomes in the Netherlands are less than 0.4% of their income (Bekkers, De Wit & Wiepking, 2017, p. 65) may lead you to ask: “Why do high income people give so little to charity?” When you ask a question like this, make the comparison explicit. A better formulation is: “Why do high income people give a lower proportion of income to charity than low income people?” This question is even more intriguing when you know that people in the lowest decile of the income distribution give about 1.2% of their income per year.
A question like: “Why do Protestants give so much to charity?” contains an implicit comparison between Protestants and other groups. Again, as per #6 above, when you make comparisons, check them. Though indeed Protestants tend to give more than Catholics or the non-religious, comparisons with other religious groups such as Muslims or Jews tend to show these groups give even more (Bekkers & Wiepking, 2011). A better research question would be “How can current differences in the US between religious groups in charitable giving be explained?”
In this particular example, you could doubt whether the amounts are ‘so much’ compared to the religious norm of tithing. Very few religious people actually give a tenth of their income (James & Jones, 2011). In this case, the more interesting research question would be: “How can current differences between religious groups in the US in the adherence to norms on charitable giving be explained?”
Generally speaking, questions including the word “so” include comparisons that you need to specify, and assumptions that you need to check.
When you ask questions about differences, make sure that they are meaningful. The question about the differences in generosity of citizens across the income distribution is about a meaningful difference: the generosity of the 10% lowest incomes is three times that of the 10% highest earning households in the top decile. Similarly, differences between religious groups are sizeable. The amount donated by Protestants in the Netherlands in 2015 was more than six times the amount donated by the non-religious. There is no rule of thumb for what constitutes a meaningful difference. Even a difference of just 1% can be meaningful when it has meaningful consequences (De Wit, Qu & Bekkers, 2021).
9. Asking a question that is too broad
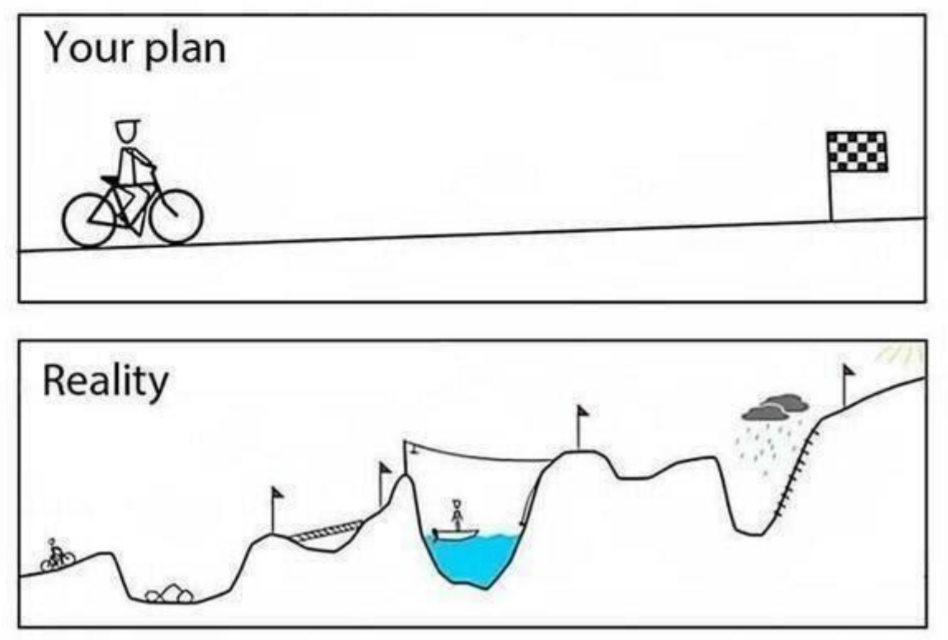
‘To what extent is volunteering motivated by altruism?’. If you ask a very broad question such as this one, you cannot expect to finish your work by the deadline. There will simply be too many aspects that you should discuss to answer the question. In the course of dealing with these aspects, you run the risk of getting side tracked, encountering dead ends, and muddy paths and swamps. Remember to not only plan ahead but also check your schedule.
Questions that are too broad not only take too much time, but are also misleading to your readers. In all likelihood your research is not going to produce an answer to the question to what extent volunteering is motivated by altruism. You may be able to answer that question for a specific form of volunteering, among a specific group of people. Your question should give the reader an impression of the kind of research you are going to do to answer it.
The solution to this problem is to specify the phenomena that you are studying a bit further. You should specify time and place. You can specify aspects of the phenomenon you are interested in, e.g. by identifying a specific type of volunteering, or by making a comparison between different types, e.g., volunteering for religious or non-religious organizations. Also you can specify relations between aspects of the phenomenon you are interested in and other variables, e.g. by identifying conditions in which altruism may occur.
10. Asking a question that is too narrow
An example of a very narrow research question is: “How can a sports club that obliges members to serve as volunteers on Sundays deal with the problem of ‘no shows’?” This is a specific policy question that may have a high level of societal relevance to the volunteer manager and the president of the club, because they cannot run it without volunteers on Sundays. But the scientific relevance of the question may low, previous research will be difficult to find or non-existent, and the empirical research you can do to answer the question will be limited in scope.
The solution to this problem is to broaden the question. In this particular case, you could ask: “What is the relationship between mandatory service requirements and the willingness to volunteer among members of sports clubs?” A follow-up question would then be “Which conditions increase the willingness to volunteer for sports clubs with mandatory service requirements?”
11. Asking a question about a state rather than a change
“How is ethnic diversity related to civic engagement?” is a question about a state: it asks about the association between two variables at a given point in time. This kind of question is not ideal because theories in the social sciences can be tested more forcefully if their implications are formulated in terms of how things change. Try to reformulate your predictions about states at a given point in time into predictions about changes over time. For instance, instead of the descriptive question about the relationship between ethnic diversity and civic engagement you could formulate the explanatory question: “How does ethnic diversity affect civic engagement?” This question will lead you to ask: “How does civic engagement change in communities that become more (or less) diverse?” By answering this question you will learn more than by answering the question whether civic engagement is higher in more diverse communities. The former research question leads you to look for change over time; the latter leads you to look for differences between communities at some point in time. In the latter case, lower levels of civic engagement in more diverse communities could reflect an influence of diversity on engagement as well as the reverse. In the former case you can look at the timing of events. If you know that first diversity increased and then the level of engagement declined, you may still not be able to conclude that the increase in diversity lowered the level of engagement, but at least you know that the change in engagement did not change the level of diversity.
12. Asking “Can” Questions about the World of Possibilities
“Can people overcome adversity in life?” is an example of a “can” question. It is not a good question, because it is too easy to answer it. As soon as you find one positive case, the answer is ‘yes’ and you’re done. The same goes for “Can X influence Y” questions. The answer in almost all cases is going to be ‘yes’. But that is not a very informative answer. We learn next to nothing from a demonstration that something is possible, unless everyone thinks it is not. We want to know whether X always affects Y, or whether there are situations in which the influence is absent, or stronger than in others. Is the influence similar for people with different characteristics, in different social groups and countries? How does the influence come about? We learn more when you report about the conditions in which it did not work. If what you are looking for is knowledge about moderators or mediators, it is better to ask about them right away. Section 3.1.4 discusses how you can do this.
“How can people make sense of adversity in life?” is an intriguing question, but not one that you will be able to answer with your research. Again, the trouble is in the word ‘can’, but in this case almost anything is possible. Some people make sense of adversity by gardening. Others by talking to friends. Still others turn to God. In all likelihood you would not be satisfied with any of these answers. Not all answers are equally useful or correct, but there is no way of knowing from the way your question is formulated. Because of the word ‘can’ it is not clear what kind of answer you are looking for.
Research questions about possibilities are difficult to answer when they lack a clear sense of direction. If you do have a few possibilities in mind, mention them in your question. In this particular case, it would also be helpful to specify a criterion. People may make sense of adversity in many ways, but you are probably interested in the origins of these different ways or their consequences. If you really do not have a clue what you are looking for, you should spend more time reading previous research and thinking about theories that may apply.
13. Asking a meaningless question
“Why are owners of yellow cars more likely to be female than male?” is a rather meaningless question. The presumption may be correct, but the answer is not consequential, neither for theory, nor for practice – unless the yellow reduces accidents. Make sure your question answers a meaningful question. This means not only that the question is about an important issue or burning question – we will get to arguments about scientific and societal relevance in section 2.3 and 2.4 below. Also you should make clear to the reader that the answer to your question is consequential. What would be the consequences for theory or practice of potential answers to your research question? What would be an informative answer that tells you whether a certain theory is right or wrong?
14. Asking a question that you do not answer
Perhaps it is obvious, but it is worth stating explicitly: make sure that your research in fact answers the question that you state in the beginning. If you do not answer the question you raise, readers will be disappointed. The implication is that you should adapt your research question to the research design of your study, at three different stages in the empirical cycle.
Design. First, adapt your research question to your research design when you are designing the study. When you work with existing data, make sure that the research question can be answered with the data at hand. When you have the opportunity to collect new data, make sure that you actually measure the concepts in the research question.
When the data you have do not include randomized treatments or randomly allocated events in natural experiments, be careful to ask explanatory questions. Make sure you use a design that allows for causal inference. See sections 4.1 and 4.2 below.
You can phrase your research question somewhat broader than the measurements allow, but avoid asking a very broad question when your data and measures provide tangential evidence. Adapt the research question to the possibilities that the type of data you will use. Specify the context when the data pose limits to the generalizability of the results – keeping issue #6 above in mind.
The rule also works the other way around: when your data and methods do not allow you to answer the research question, you can also choose to continue searching for more suitable data and methods that do allow you to answer the question.
Analysis. Once you are in the fieldwork or data analysis stage, you may discover that what you thought was possible is in fact impossible. The dataset does not cover the countries or time points that you were interested in, it does not include good operationalizations of the concepts in your question, or it does not have the longitudinal structure for the variables you are most interested in. Also the assumptions for causal inference may not be satisfied. In these cases reformulating your research question to a question that your analysis does allow you to answer is often the best option.
Writing. Once you are done with your empirical work, check what you promised in the description of the design of your study. Do not mislead your readers or disappoint them by asking a different question than you are able to answer. To some extent, this is a matter of planning: reformulate your research question again and again, until it is capturing your research perfectly. If your research changes along the way, reformulate your original question.
15. Asking a question that others have answered already
Finally, you want to make sure that the question you are asking has not yet been answered already. Once you have started to gather previous research, you may be discouraged by how much research has already been done. This does not mean that your research is not useless. Instead, you will discover that most previous research is not flawless and sometimes even useless. Whatever you think the bar is for what constitutes a good answer to your question, raise it a bit further. Very few studies have a waterproof design and analyze complete and accurate data to produce definitive evidence on your question and conclude by saying that future research is not necessary.
Recap & Research Question Checklist
Summing up, phrased positively: a good research question is…
- A question, not a topic.
- Testable.
- Substantive.
- Informative.
- About shades of grey.
- Based on valid assumptions.
- Identifying time and place.
- About meaningful differences.
- Narrow enough to be answered.
- Broad enough to be interesting.
- About changes rather than states.
- About reality rather than possibility.
- One with consequential answers.
- Answered by your research.
- Not yet answered by previous research.
2.4. Societal relevance
The societal relevance of your research is determined by the implications that your results have for public debates and choices by citizens and policy makers. Simply stated: the societal relevance paragraph answers the question: “SO WHAT?” There are two types of societal relevance: the relevance for social issues and the practical or policy relevance. If your research tells you that people are happier when they pay others to outsource household tasks they dislike, for instance, citizens can take that as an advice to examine their household budget and the tasks they are not outsourcing to see which ones they dislike. This result is of practical relevance. An example of policy relevance is the conclusion that donations to charity are more effectively encouraged by price reductions in the form of rebates than by matches. The result suggests that income tax deductions for charitable donations are suboptimal.
The question you should answer in the paragraph about the societal relevance is: “Who will be interested in your research and why?”. Or in other words: whose minds are you going to change about what? (King, 2018). In this paragraph you are selling your research. So: present your unique selling points to the audience that is likely to be interested. Determining the composition of that audience is your first task.
2.4.1. Who cares?
When you try to sell your research, think about what kind of audience may be interested, and address that audience. To identify your audience, ask yourself: who cares? Groups of actors that may be interested in your research include: policy makers, in government or in organizations; politicians; consumers; patients; voters; volunteers; donors. Certainly those who are in a position to change the behavior of people and the policies that affect that behavior are part of your audience. But the audience may be much broader: perhaps mankind as a whole should be interested.
2.4.2. Why bother?
Prototypical arguments about societal relevance start with the following observations:
- A lot of money (time, resources) is at stake. Quote a study from an authoritative source quantifying the amount at stake. For instance: “Each year, an estimated 7 million people in the Netherlands are active as volunteers (Statistics Netherlands, 2011).”
- People are concerned about your main dependent or independent variable. The concern could be that the desired amount will decline, or that the phenomenon that you are studying will disappear altogether. Refer to statements of politicians, influential views expressed in op-eds, results of surveys and polls on the problem that got into the media.
- A lot has been tried to avoid or promote your dependent variable, but…
- … it is not clear whether or to what extent these interventions have worked – i.e. whether the interventions have been effective or not.
- …it is clear that these interventions have not worked, and now we want to know what kind of alternative solution would work.
- …it is not clear to what extent the interventions have been efficient.
- …it is clear that the interventions have not been efficient, and now we want to know what alternative interventions would be more efficient.
When you make the case for your research, make sure to complete the argument about the relevance of your research by relating your research question to the policy implications of various answers to your research question. The starting points above merely indicate to the reader that your topic is relevant. They do not yet tell the reader how your research is going to make a difference. Remember that you are seeking to answer a specific research question about your topic. Your argument should be based on the policy implications of certain answers to your research question.
For instance if your research shows that a certain policy which has been used to tackle a problem is ineffective because it does not involve key stakeholders, your recommendation could be that involving them might help, and future research should investigate what type of involvement is most effective. In the introduction you can make the case that current policy has been ineffective but we don’t know why, and that your research will test two (or more) possibilities. You can then say that policy recommendations would be different depending on which possibility is supported by the evidence. In the discussion section you can elaborate on the advantages and disadvantages of various strategies suggested by the evidence, and the context characteristics that will influence their effectiveness.
2.4.3. How will you contribute?
A good argument for the societal relevance could be that your research helps people make decisions in practice. For instance, your study may demonstrate which of two interventions is more effective in reaching a certain goal. Your study may also reveal new details about people who demonstrate a certain behavior or hold certain opinions. Such knowledge can be useful for people who would like to achieve certain goals or reach a certain audience. However, be careful not to promise too much. It is often very difficult to get from knowledge about what works to a large-scale, successful intervention with the same effect as in the original study. Knowledge about characteristics of people hardly ever tells you what to do to successfully influence them. In order not to disappoint your readers with a zillion qualifications in the discussion, it is better not to promise that your study will have world-changing revolutionary influence.
2.5. Scientific relevance
The question you should answer in the paragraph about the scientific relevance is: “What will this new research add to the existing body of literature, and why is that an important addition?”. In other words: what is the innovation in your research?
Prototypical arguments about scientific relevance are:
- You will Discover: there are no data available in previous research about the phenomenon that you study.
- You will Replicate: previous research has concluded that X influences Y. You will check whether the same relationship can be found in another set of observations.
- You will resolve an Anomaly: there are observations that seem to reject existing hypotheses or theories. Your research will clarify what is going on.
- You will solve a Mystery: we do not (fully) know how to explain Y. Your research will add to a piece to the puzzle.
- You will follow Leads: we think we know that X influences Y, but we are not sure. Your research will show to what extent X influences Y.
- You will open a Black Box: we do not how to explain the correlation between X and Y. Your research will show how X influences Y, through which intermediary variables.
- You will use Better Methods: previous research has relied on research designs that are not fully adequate to answer the research questions. Your research will use more refined, sophisticated, and stringent data and methods.
- You will Reopen a Closed Case: previous research has concluded that X influences Y, but there are reasons to doubt this conclusion. Your research will show to what extent X really influences Y.
- You will Generalize: previous research about X and Y was about context A, but you study context B.
Let’s go over each of these types of arguments one by one.
2.5.1. Discover
Your research can contribute by charting unknown territories, collecting data on phenomena that previous researchers have talked about but have not actually described. By providing the first empirical analyses of a certain phenomenon, you may provide the ground work for future research. Of course you have to make sure that you are really the first one (see section 3.4).
2.5.2. Replicate
If previous research came to a surprising conclusion on the relationship between two variables, it would be good to check whether the same conclusion emerges from a similar analysis of other data, including the same variables. Don’t be surprised if your replication generates results that differ from previous research. Due to publication bias, p-hacking, and other forms of research misconduct and flaws in the process of academic research, replications often ‘fail’ (Simmons, Nelson & Simonsohn, 2011; Open Science Collaboration, 2015). Also if previous research has yielded mixed results it is illuminating to replicate. Perhaps your research can show why previous research has yielded mixed results. Even if that is not the case, it is interesting to have an additional piece of evidence on the relationship.
2.5.3. Resolve an Anomaly
A good starting point for a scientific discovery journey is an anomaly: an observation that cannot be explained by prevalent theories in your field because it the observation runs counter to predictions from these theories. In research on volunteering for instance it has frequently been observed that persons who earn higher incomes are more likely to volunteer than persons with lower levels of income. This runs counter to the opportunity cost theory of volunteering (Menchik & Weisbrod, 1987; Wilson, 2000; Carlin, 2001). Persons who earn higher incomes lose more by providing their labor without monetary compensation and should therefore be less likely to volunteer, everything else held constant. The question why people with a higher level of income volunteer more poses a puzzle for the opportunity cost theory.
2.5.4. Solve a Mystery
Perhaps an even more compelling starting point for scientific discovery is a mystery: a phenomenon that we do not understand and cannot explain. The discovery (2.4.1) of a phenomenon may give rise to a mystery if no theory is able to explain its occurrence and origins. The mystery bears resemblance to the anomaly: it is also a puzzle. The difference between an Anomaly and a Mystery is that we have no theoretical basis from which we perceive the phenomenon as impossible or unlikely. The best mysteries are those for which we have clue where to start searching for an answer, and no evident starting point of explanation. Total mysteries are rare. In the more likely case there is a theory (or a set of theories) that does not fully explain why a certain phenomenon occurs. Your job is to sort out what additional explanations provide a more complete account of the phenomenon.
2.5.5. Follow Leads
In some respects, science is like solving a murder case. You follow leads to find the person guilty of the murder. The best way to find the killer is to follow multiple leads, and to stop searching when a lead does not seem to be promising any more. Following only one lead may lead to tunnel vision in which all evidence is interpreted as a confirmation of the initial suspicion.
The analogy with science is the terrible trend towards more publications of positive results: a growing proportion of papers in (international, peer-reviewed, and high ranking) academic journals is reporting confirmations of hypotheses rather than rejections (Fanelli, 2012). Support for a certain – often new – hypothesis adds less to our body of knowledge than rejection of an old hypothesis.
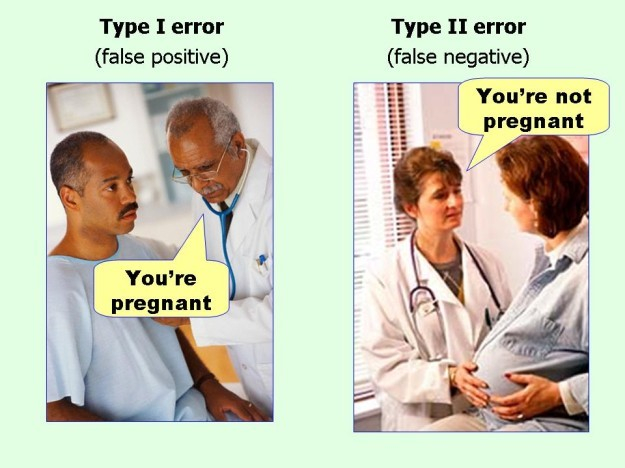
In other respects, science is like criminal justice as well. In the legal system, convicting an innocent murder suspect is viewed as a more severe disadvantage than setting free a killer due to lack of evidence. Avoiding false negatives (type II errors) is viewed as more important than avoiding false positives (type I errors).
Table 1. Errors in hypothesis testing
|
Hypothesis is not true
|
Hypothesis is true
|
Hypothesis accepted
|
Type I error
False positive
Convicting an innocent suspect
|
No error
True positive
Convicting a killer
|
Hypothesis not accepted
|
No error
True negative
Setting free an innocent suspect
|
Type II error
False negative
Setting free a killer
|
2.5.6. Open a Black Box
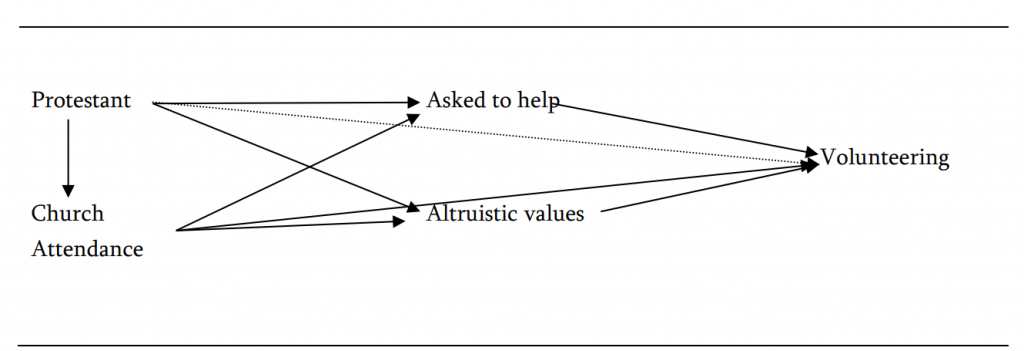
When previous research concluded that two variables are related, the question is how the relationship can be explained. Often you can find arguments in previous research about why the relationship exists without an explicit test of this argument. You can open the black box by formulating and testing hypotheses about the variables that mediate the relationship. The strongest contribution you can make in such a situation is to formulate multiple hypotheses about mediating variables. Figure 4 below shows a model of the relationship between religious affiliation and volunteering, answering the research question why protestants are more likely to volunteer than non-religious persons. The model includes two different mediating variables: solicitation and altruistic values.
2.5.7. Use Better Methods
Innovations can also be in the methodology you use. If you use better methods to evaluate a hypothesis that has been proposed earlier than previous studies, then you are innovative. For instance, if we do not know whether the correlation between X and Y reflects a causal influence of X on Y and your research uses longitudinal or experimental methods that get at the direction of causality in the relationship, it is innovative.
2.5.8. Reopen a Closed Case
Sometimes the literature provides a very clear answer to a research question, but you have reasons to believe that the consensus is ill-founded. New data (see 2.4.1) or the use of better methods and research designs (2.4.7) may cast doubt on commonly held beliefs. In these cases, your research provides new insights.
2.5.9. Generalize to New Cases
Previous research has examined the causes you are interested and their consequences in certain times, places, and persons or organizations. Your research studies familiar Xs and Ys, but in a different and place, and among different actors (see 3.6.4).
2.5.10. Pitfalls in descriptions of scientific relevance
Examples of phrases that suffer from typical problems in formulations of scientific relevance are:
Figure 3. A bunch of firebugs.
1. “This phenomenon has never been studied before.” This is not a good argument. It is merely a statement of fact – one that you should check before you write it down, by the way. An example may serve to illustrate why it does not apply in general. We don’t know much about the secret life of firebugs. There is a very good reason why we don’t know much about the secret life of firebugs: it is totally uninteresting!
|
Firebugs may look dangerous, but they are harmless animals. They would be interesting if they provide an Anomaly, a Mystery, Leads, or if knowing more about them opens a Black Box.
|
2. “This phenomenon has been studied frequently in previous research.” Without additional arguments this is not an adequate justification of the scientific relevance of your research. If there is so much prior research, then what does your research add to it?
3. “This phenomenon has recently attracted a lot of attention from scholars.” Well, why have others found the phenomenon interesting? Do they give sound arguments? Without any additional arguments you may be saying that you are following the mistakes of others.
4. “This phenomenon has generated heated debates in the media.” The fact that people are debating about an issue does not in itself justify attention from scholars. Media attention because people are concerned about an issue is a sign of societal relevance, not scientific relevance. However, it can be very useful to inform the public debate by the facts. The public debate can be ill-informed, misguided by incorrect theoretical assumptions, or methodological pitfalls such as claiming causality on correlational evidence or unjustified generalizations to a broader population. In this case, scientific attention is warranted to inform the public debate.
5. “I am a … myself.” In many cases people study phenomena that they are somehow personally involved with and do so because of that personal involvement but do not report this. Scrutinize the roots of your research questions and try to evaluate in all honesty how this personal commitment may affect your judgment. You need not be an immigrant to study remittances or a high net worth individual to study philanthropy by the wealthy; neither do you need to be a completely impartial observer. It does help, however, to review your own arguments again taking the position of such an impartial observer.
6. “This study contributes to the literature.” Do not overpromise your contribution and what the contribution is exactly. When you plan your research, you may think you can make all sorts of contributions. It is good to start ambitiously, but when you have completed your research, reread your introduction and revise your statements. The contributions you thought you could make may turn out to be less revolutionary. That is fine. A typical outcome of research is that things are more complicated than they seemed at the beginning.
3. Developing your theory section
In this section, you present the ideas that you want to test in the empirical part of your research. The best way to develop your theory section depends on the availability of data. If you must work with a given dataset, the best way to go forward is to look at the variables in your data, and draw a causal model including the variables that are at the heart of your research. If you can collect your data yourself, e.g. by conducting an experiment, a survey, or interviews, the best way to go forward is to read a recent literature review on your research problem and work from there. If there is no literature review available on your research problem, you will need to write that review yourself. Paragraph 3.3. explains how you can do that.
3.0. When to write it
Remember to work in the right order (see section 1.2 above). So the first advice I would like to give you is: write the theory section first, before you have collected or analyzed your data. Identify the theories that are most relevant for your research, and narrow down broad concepts to variables that you can measure. Write down the hypotheses that you will test before you have seen the data, for instance as part of a preregistration (also see section 4.0 below). You can preregister your study at several platforms, such as aspredicted.org or the Center for Open Science.
Writing your theory section before you have analyzed, seen or even collected the data avoids HARKING: Hypothesizing After Results are Known (Kerr, 1989). It is all too easy to paint a target after you have fired your guns and then claim you were 100% accurate. Your hypotheses are ex ante predictions based on theories, not post hoc interpretations of your data. Preregistration of your research questions and hypotheses proves that you have not been harking.
This forces you to think hard about your predictions. About which ones are you really confident? These are the predictions that belong in your theory section as hypotheses. You will probably be interested in many more relations in the data, without having a clear idea about their sign or strength. These are analyses that you can plan as exploratory analyses, without specifying a hypothesis about them.
The goal of formulating a hypothesis is not to maximize the chance that the analysis will confirm it, but to maximize the implications of testing it. By only formulating a hypothesis when there is a strong theoretical foundation for it, a rejection of the hypothesis by an empirical test is more informative. When the foundation for a hypothesis is shaky to begin with, we do not learn much from a rejection.
3.1. Composing a causal model
In the opening paragraph of your theory section, present a causal model that represents how you think the phenomena that you are studying are related. You can think of a causal model as a simplification of the chain of events that leads to a certain outcome. The core of any causal model is a relationship between a cause X and its effect Y (see Figure 4).
Figure 4. Causal diagram example: a direct causal effect
Take the example of a campfire that results from striking a match in a small pyramid of dry wood. Striking the match (X) caused the wood to catch fire (Y). This example is very different from the typical chain of events that we are interested in as social scientists. We are often interested in differences in social behaviors between groups or individuals with specific characteristics that differ between groups. Typically, there is not such a strong relationship between the outcome and the preceding chain of events as in the case where striking a match leads to fire.
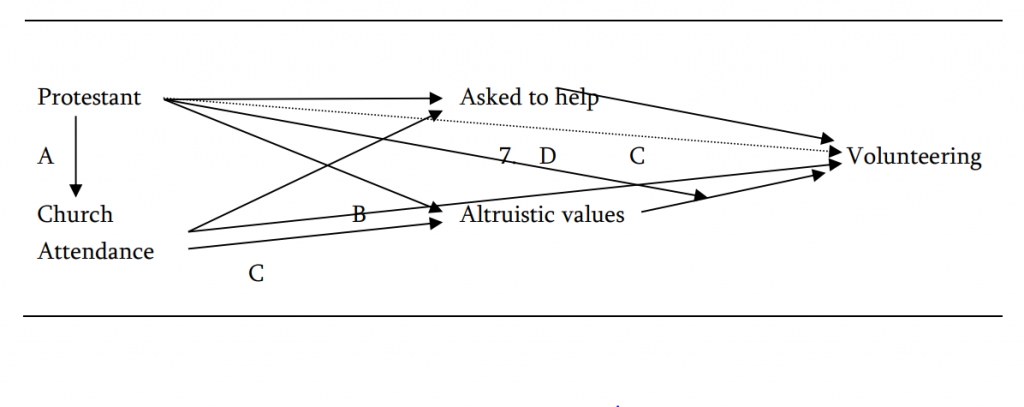
For the reader it is convenient to see the causal model before you explain the hypotheses you will be testing, because the model provides an overview of what follows. To stick with my own advice, consider the example in Figure 5, based on Bekkers & Schuyt (2008).
Figure 5. Causal model. Note: all relations are hypothesized to be positive.
In thinking about the model, it is best to work in the following order.
1. Select your dependent variable (Y).
The dependent variable is the phenomenon you are trying to understand or explain, by relating it to the conditions in which it occurs, the characteristics of people who are involved, how it changed over time, or how it varies between groups or nations. The name ‘dependent variable’ implies that it depends on something else, and that it can vary. A characteristic that does not vary – such as birth year – is not a variable, but a constant.
In the example in Figure 5 the dependent variable is volunteering, spending time working without pay for a nonprofit organization. I am intrigued by questions on prosocial behavior. Why do some people volunteer, while others do not? Volunteering depends on many factors, but in the model I have deliberately considered only a few. Models are simplifications of reality, and this one is no exception. We could draw a more explorative model including clusters of variables; this strategy is discussed below (see section 3.2).
2. Pick your main independent variable (X).
The independent variable is a cause of the phenomenon that you are trying to explain. In time, the independent variable precedes the dependent variable. The change or the event that you think is a cause must have happened before the outcome occurred.
In the example, the main independent variable is ‘Protestant’. We think that some people are more likely to volunteer than others because they are Protestant instead of not religious, Catholic, or belonging to another religion. It is a variable because it varies between people in the population, though it is not very variable over time within people: it does not change easily as a result of other variables. In this sense, it is an independent variable. Being Protestant is similar to ‘striking a match’ in the example of how striking a match causes fire.
3. Next, identify mediating variables (M), if any.
A mediating variable is a variable in between the cause and the effect, explaining why the cause has a certain effect. Mediating variables are also called ‘mediators’ or ‘intermediate variables’. A mediating variable depends on an independent variable, is a result of that variable, and explains the relationship of that independent variable with the dependent variable. You can think of a mediator as an event that changes as a result of a prior event, and leads to a future event. Without the mediating variable, the cause would not have the effect you observed.
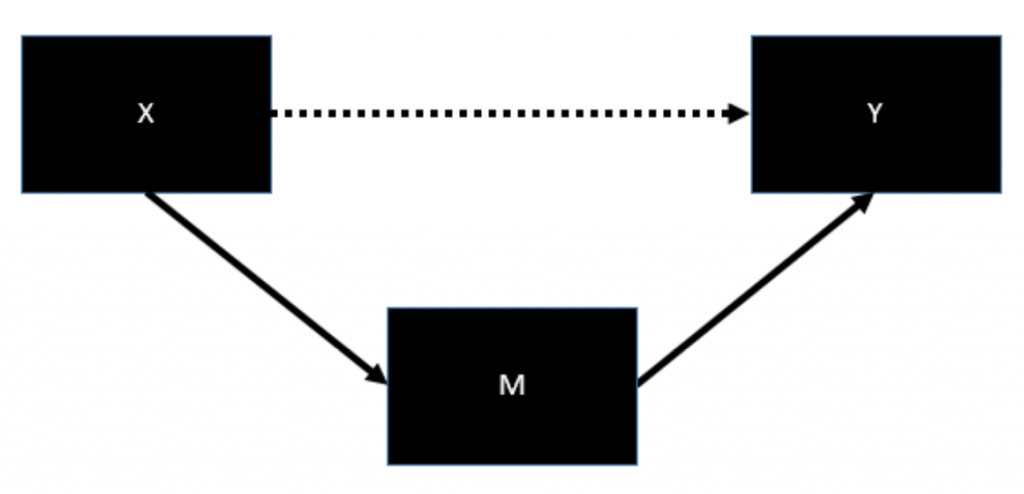
In the causal diagram, the mediating variable is labeled ‘M’. The variable is positioned between the independent and the dependent variable. The relationship between X and Y is called the ‘direct effect’: there is nothing between X and Y, the effect is direct. The relationship between X and Y that flows through M is called an ‘indirect effect’. In the diagram, you can show that the relationship between X and Y is mediated by M by dotting the arrow between X and Y. You can display the initial relationship with a plus or minus sign, and add brackets to display your hypothesis that the relationship is mediated by other variables in the model. In the example above I have not done that, because I have assumed all relationships to be positive.
Figure 6. Causal diagram example: a mediating variable
In our example, the relationship between Protestant and volunteering – i.e. the higher level of volunteering among Protestants than among the non-religious and other religious groups – is mediated by two variables: being asked and altruistic values. We think that people are more likely to be asked to volunteer and have stronger altruistic values because they are Protestant, and that they are more likely to volunteer because they are asked. Also we think that we think that people have stronger altruistic values because they are Protestant, and that they are more likely to volunteer because they have stronger altruistic values. Being asked and altruistic values are similar to the friction that occurs as a result of the striking of a match. The striking of the match causes friction, and the friction causes the tip of the match to catch fire.
4. Identify moderating variables, if any.
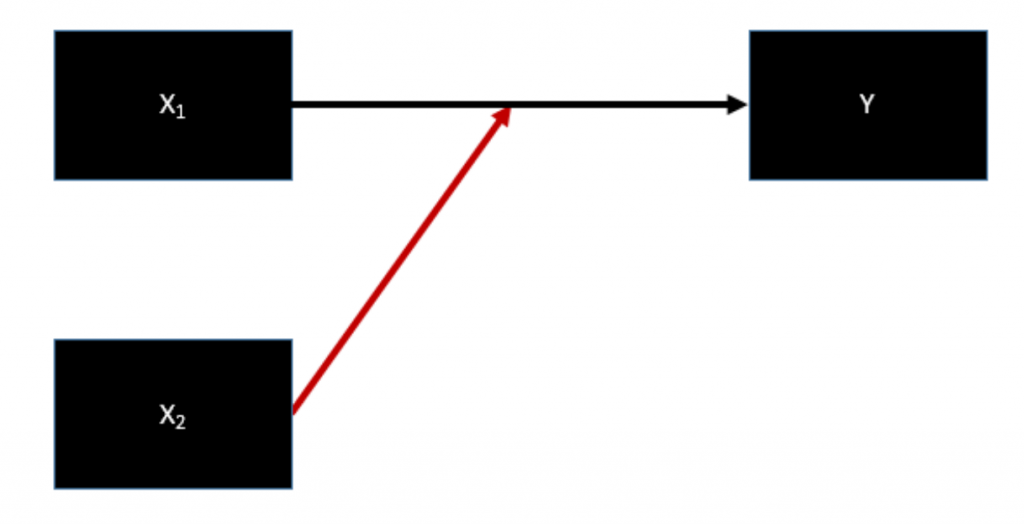
A moderating variable is an additional independent variable (X2) that changes the influence of the main independent variable (X1). In the example of the match, you can think of oxygen as a moderating variable: when we strike a match, the presence of oxygen enables the tip of the match to catch fire. Striking a match in a room without oxygen would not result in fire. You can think of moderating variables in terms of necessary but not sufficient conditions. If there is oxygen, lighting the match sets it on fire. But the mere presence of oxygen does not cause the match to catch fire. In the social sciences, moderating variables are rarely necessary conditions, but mostly probabilistic.
Figure 7. Causal diagram example: a moderating variable
In our example of the relation between religious affiliation and volunteering there are no moderating variables. If we would assume that among Protestants the relationship between altruistic values and volunteering is stronger than among the non-religious, ‘Protestant’ would be a variable moderating the relationship between altruistic values and volunteering, and an additional arrow should be included to visualize this hypothesis. The model would then look like Figure 8 below. Arrow D represents the moderating influence of Protestant affiliation on the influence of altruistic values on volunteering. The influence of altruistic values on volunteering is positive, but may be stronger for certain groups, such as Protestants.
5. For each relationship in the model, identify the sign of the association.
You can identify the sign of the association – positive or negative – by using different colors, or adding signs. In the causal diagram examples, I’ve displayed positive relationships with black arrows, and negative relationships with red arrows. If some of your associations are stronger than others, you can display the strength of relationships using multiple signs, such as ++ or --.
6. Think about the relationships that are not in your model.
Is your model complete? Does it include all relevant influences? In most cases, you cannot include all the variables that influence your outcome. This is only a problem if the influence that you leave out will change the strength or the sign of an influence that is included in your model. We will discuss those below. Arrows that you could have drawn but did not include in the diagram are in fact hypotheses about null-effects: you expect these paths to be absent.
7. Think about variables that are not in your model.
In the social sciences there are many factors that we have not measured. These are omitted variables. In the example of the match, the moisture level of the wood is an important omitted variable. The more humid the wood is, that less likely that the match causes the wood to catch fire and keep burning. This omitted variable is a moderating variable: it reduces the effect of striking a match. The variable itself does not depend on anything else in the model, but will moderate the effect size you observe.
Figure 8. Causal model with letters
In our example of religious affiliation and volunteering, age is likely to be an omitted variable. Older people are more likely to be protestant and attend church more frequently than younger people. By omitting this variable, the relationship of religiosity with volunteering will be overestimated. The relationship of age with volunteering will be absorbed by the variables in the model.
Drawing the model
- The model works from left to right, not from top to bottom. The order of the variables is the order in which they are assumed to influence each other over time. Variables on the left are called independent variables because they do not depend on anything else; they are given, immutable data. ‘Protestant’ is an independent variable because one’s religious affiliation is determined at birth and a relatively stable (though not immutable) characteristic afterwards. Also the frequency of church attendance is a relatively stable phenomenon. How often one encounters requests to volunteer is a more variable characteristic. Also altruistic values are assumed to be open to change. Solicitation and altruistic values are both assumed to be the result of being Protestant and going to church, and not the other way around.
- In a causal model, each variable occurs only once. If you are unsure where to place a variable because there is no obvious chronological order, ask yourself two questions: (1) Does it depend on other characteristics that I already have in my model? (2) Can it have an influence on other variables in my model? In the example, you can figure out that ‘Protestant’ should be placed left of ‘Solicitation’ by asking yourself “How many people change their faith and become a Protestant because they have received solicitations for contributions to nonprofit organizations?” The obvious answer is: not many (if any).
- All relationships are assumed to be positive, and signs are omitted, except for the hypothesis about being Protestant moderating the relationship between altruistic values and volunteering. No expectations are expressed about the strength of relationships.
- In this model, the arrow from Protestant to volunteering is dotted. The higher proportion of volunteers among Protestants is expected to be the result of the higher likelihood of being asked to volunteer, and the higher level of altruistic values among Protestants.
- It takes some time and practice to order the variables in your model in a neat way. Start out with a sketch pad. Just start over when your model gets cluttered, when you discover that a variable is in the wrong place, or when you draw arrows that intersect each other.
You should display at least three variables in your model – the dependent, the independent and at least one mediating or moderating variable. As a rule, a causal model including multiple mediating variables is to be preferred above a model including only one. Because the model in Figure 8 includes two mediating variables it is better than a model with only one mediating variable. If we obtain support for mediation of the relationship between church attendance and volunteering by solicitation in an analysis ignoring altruistic values we cannot know if the relationship is retained when altruistic values are included.
Ideally, you construct the causal model based on your reading of the literature. Which mechanisms are implied or mentioned in theories about religion and civic engagement? And which mechanisms and conditions are examined in previous research?
- “How can I know for sure whether a variable is a mediating variable?”
When you are constructing your causal model, it can be difficult to determine theoretically whether a factor that you think is important is a mediating variable or a moderating variable. You can use the following rules:
- If the factor you are thinking about depends on other factors in your model, it is a mediating variable. It cannot be an independent variable. If you ask yourself the question “Does X influence Y?” and you find yourself answering “because…”, you are giving arguments about mediating variables.
- You can identify moderating variables by using the phrase ‘it depends’. If you ask yourself the question “Does X influence Y?” and you find yourself answering “It depends…”, the factors that you think the influence depends on are moderating variables.
- “What constitutes a good ‘explanation’ of a relationship?”
Specifying a mediating variable is one way to explain the relationship between an independent and a dependent variable. Such a proximate explanation works forward in time: if it were not for the influence of X on the mediating variable, there would be no link between the independent variable and the outcome Y. For many relationships, you can think of multiple mediators. A good forward explanation of a relationship implies that you identify at least one mediator, and preferably distinguish several mediators. Discuss their interrelationship. In most cases, the various alternatives are not mutually exclusive: they can simultaneously be true.
Explanations can also go backwards in time, seeking an answer to the question: and where does X come from? In the example above one could argue that a Protestant religious affiliation is the result of parental religiosity and religious socialization. Thinking about the more distant conditions or events that cause X will enlarge your causal model, and turn your X into a mediating variable. Parental religiosity is related to giving and volunteering through children’s religiosity. The prediction from this model would be that children of Protestant parents who have left the church and are not affiliated anymore with Protestant church are not more likely to give and volunteer than children of parents who were not religious.
3.2. The cluster model
The example above is typical for a study in which hypotheses are tested. If your research is of a more exploratory nature it may be difficult to draw a causal model. This will be the case when you do not have clear hypotheses to test. It is also difficult to draw a causal model when you are not yet sure how to operationalize the concepts. In this case, you can start with a more generic model, identifying clusters of variables, such as ‘personality’ (rather than ‘extraversion’ or ‘neuroticism’). Figure 9 shows such a model, similar to Figure 8. In Figure 9 the plus and minus signs are omitted because some variables within the same cluster have positive relationships and others have negative relationships with variables in other clusters.
The cluster model is a typical starting point for research seeking to explain a certain dependent variable as good as possible. In this case you try to find the most relevant groups of factors that explain variance in the dependent variable. A typical research question for studies of this kind is “How can Y be explained?” or “Why do people Y”?
If you have trouble thinking about the clusters of variables in your model, the following creative thinking exercise may help. Replace your dependent variable by a different one, and go over your hypotheses again. Would they hold? In the example above, suppose we would replace ‘prosocial behavior’ by ‘aggression’. Which mechanisms would link religiosity with aggression, if there is any relationship to begin with?
Figure 9. Causal model consisting of clusters of variables
3.3. Getting to a causal model
Constructing a causal model from scratch may be difficult. Especially if answering your research question involves theories from multiple disciplines, it is unlikely that you can rely on causal models from previous research.
If you use existing data sources, and cannot gather additional data, start with drawing a causal model including the variables available in your dataset. Also if you collect your own data, drawing a causal model connecting the variables that you will collect data on is a helpful tool to get your thoughts in order.
To construct a comprehensive causal model, it is often to start working from the question: “Who does what, when, how and why?” This question consists of three parts. For each of these parts you can design a model:
- The “Who does What?” part can be displayed in an actor model, that identifies the relevant actors in a field.
- The “What happens When and How?” part can be displayed in a process model, that identifies chronological phases in the process that you are trying to understand.
- The “Why?” part is displayed in a causal model.
3.3.1. Actor Models
Actor models are useful because they identify different groups of actors that are important in a field. An example of an actor model is displayed in Figure 10. The figure shows three groups of actors: donors, intermediary organizations, and recipients. Donors form the supply side of contributions; nonprofit organizations represent recipients and form the demand side of contributions. It is important not only to identify who acts, but also what these actors do. When drawing an actor model, ask yourself: Who does What?
This model contains no positive or negative signs because some characteristics of the actors have positive relationships and others have negative relationships with characteristics of other actors. Also it is difficult to quantify the importance of the actors. The importance can be determined in various respects that cannot easily be displayed as causal influences.
Figure 10. Key actors involved in philanthropy (Bekkers, 2010)
3.3.2. Process models
Process models are useful to establish the temporal order of variables. An example of a process model is displayed in Figure 11. The model simplifies the actor model somewhat, showing only two of the actors (donors and nonprofit organizations) from Figure 10 in separate rows.
Figure 11. Process model of philanthropy
Process models typically include too many variables for a single research project. One could design a complicated causal model for each of the phases. Figure 11 contains many interesting research problems. One example is: “How do potential donors decide what amount to donated to nonprofit organizations?” This research problem concerns only one phase of the process (Phase 5) and could be the question to be answered in a bachelor or master thesis. A second research problem concerns two phases (Phase 1 and 2): ; “How do nonprofit organizations design programs to address needs of recipients?” This question is too broad for a bachelor thesis; it could be a question to be answered in a master thesis. A third research problem, “How do fundraising campaigns of nonprofit organizations express needs of recipients and how do perceptions of these needs by potential donors influence charitable giving?” concerns three phases (Phase 3, 4 and 5). This question deserves a PhD dissertation.
3.3.3. Typologies, mind maps and conceptual models
In addition to actor models and process models there are three other forms of models: typologies (or idealtypes), mind maps and conceptual models. If you are writing an empirical paper or thesis in which you are testing hypotheses my advice is to minimize the use of typologies, mind maps and conceptual models. Typologies and idealtypes may be useful heuristic shortcuts when you want to classify actors or phenomena. They hinge upon the systematic co-occurrence of characteristics, some of which may be clustered.
The causal model is by far the best tool to display hypotheses. The other models include too much information, are too general or abstract, or include the wrong kind of information – the kind that cannot be used to formulate a hypothesis. Certainly do not include mind maps or conceptual models in your theory section. Some of the other models may be useful when you have trouble to come up with hypotheses. But they tend to get confusing when you include arrows that reflect causal influences.
In truly exploratory research it is good to start with a mind map, in which relevant concepts are logically ordered from a core to an increasingly distant periphery. Mind maps may be useful when you are working in a group and you need a common understanding of the logical order of concepts. However, a concept is not a hypothesis about a relationship between two variables. Conceptual models suffer from the same problem as mind maps: arrows in conceptual models reflect theoretical linkages, but not causal influences.
3.3.4. From a cluster model to a causal model
A common problem in the construction of causal models is that clusters of variables appear that summarize groups of variables: you find yourself putting ‘differences’, ‘individual characteristics’, ‘social groups’ or ‘external factors’ in boxes and drawing arrows between them. The problem of such a model is that it encompasses too many variables to be tested. It does not give you much direction in your analyses. Anything goes. If your research is purely exploratory, that is fine. But in the more frequent case, your cluster model is a result of not choosing the most relevant variables. The challenge now is to get to a more limited set of variables. Which options are possible within the clusters that you have identified? Which differences, characteristics, groups or factors seem most interesting? When you put these words in the model, force yourself to specify which one is most important. This does not mean you have to limit yourself to just one forever. You must kill your darlings – but you can save them for later.
3.4. Writing a literature review
A literature review is an important element in a research proposal, a master’s thesis, a PhD dissertation, and papers reporting empirical research. A literature review can take many forms, depending on its purpose, the audience it addresses, and the breadth and depth of the research it describes. In the case of an empirical paper, the purpose of the literature review is to provide the basis of the theoretical model that you are going to test. This is also the purpose of the literature review for a bachelor thesis, master thesis, and dissertation. Your review should address a relevant research question and should generate the hypotheses to be tested in your own research.
When you are writing the review, keep in mind that the audience is wider than the person who happens to be your supervisor. Your work should contribute to the academic debate. With your thesis you become one of the scholars who are working in the field you are interested in. When you are developing a research proposal or a dissertation plan, the literature review is a more comprehensive endeavor, and should form the basis for at least the empirical work you plan to do. In the best case your review also inspires the work of others.
In all cases, your review should present an integrated narrative of the research on your research problem, and an overview of relevant questions that are not yet answered in existing research. Do not present the studies you read one by one, in a laundry list ‘he said, she said’ manner (Thomson, 2017).
Instead, present the hypotheses investigated and tell the reader to what extent these hypotheses have been supported or rejected. Order your hypotheses logically rather than in the chronological order in which the research you have read has been published. It works well to present the key variables in the literature in the form of causal or cluster model. When you discuss results of previous research on a specific hypothesis, identify the relations between publications.
Your review is not merely a summary of prior research, but also provides an assessment of the quality of that research. Offer criticism on past research. Do so only after you have read the research. Which problems with the methodology of previous research can you identify? Remember that your thesis should contribute: it should address a new question, solve a theoretical puzzle, or repair a methodological weakness. Therefore your literature review should not be a laundry list of summaries and abstracts of potentially relevant publications.
3.4.1. Gathering materials
Start your literature review by gathering relevant publications on your research problem. First select a database. Personally I use Google Scholar, https://scholar.google.nl/, because it is the most comprehensive database of academic literature available, covering 93-96% of all published articles (Martín-Martín, Orduna-Malea, Thelwall & López-Cózar, 2018). Other databases you can use are PubMed, Scopus, and the catalogue of your local university library.
The first step in your review is finding the right keywords. I recommend that you enter the dependent and independent variables from your model as keywords.
In all likelihood you will get thousands of results, among which many are irrelevant. Your first task is to decide which of these results are relevant and which are not. You can think of the results you get for your query as opening up a storage locker bought through an auction (Figure 12). Once the door is opened you will see a lot of junk, some of which you can use.
Figure 12. Search results for a literature review. Source: unknown.
My advice would be to start with a pile of papers to read that is as small as possible, making sure that the papers you have on that pile are absolutely necessary to read because they are of key importance. Start with the three most relevant publications, and put previous literature reviews on top. Create a second pile of less relevant papers. Quickly screen publications based on their titles and the first lines of the abstracts.
The second step in your search is refining or changing the keywords. If you get very few relevant results you will need to change the keywords you use. If you get too many results, but not many relevant ones, you will need to refine the keywords. Think of synonyms for the variables in your model, e.g. ‘religious affiliation’ rather than ‘religion’, or ‘level of education’ rather than ‘achievement in education’. Findings that are relevant for your research may be published in different disciplines, each with their own jargon. What is called ‘sex discrimination’ in one field may be called ‘gender discrimination’ in another.
If you are lucky, you will find an inventory list of all the items in storage: a literature review of previous research. Someone who already did your job. I recommend you start your literature review by locating the most recent literature review on the combination of concepts in your model. Search for this guide first by adding “literature review” to your search terms. In all likelihood, however, you will not find a literature review that precisely matches your research question. In this case, you will have to do the review on your own.
The third step is screening the abstracts. As you go through them, set a high bar. Keep the pile of relevant publications as small as possible. Weed out publications that do not fit your selection criteria from the gross list of potentially relevant results. After exclusion of irrelevant publications you can start reading.
Gathering materials is an iterative process. Keep in mind that you may have used the wrong keywords, and change or refine them when they do not produce relevant research.
The fourth step is prioritizing the list of relevant publications. To decide which papers are relevant for your research question, you need selection criteria for inclusion in your literature review. Start with a fairly narrow list of selection criteria. You can think of criteria such as:
- Research question: exclude publications that do not answer your research question and do not provide results bearing on your hypotheses;
- Publication status: only include publications in international academic journals, exclude working papers, book chapters;
- Language: exclude publications in languages that you and your audience cannot read;
- Publication date: exclude publications before (or in more rare cases: after) a certain date;
- Country of origin: exclude publications from specific geographic areas;
- Participants: exclude publications using specific categories of actors as participants such as children, elderly persons, organizations;
- Methodology: exclude research with specific research designs, such as case studies, experiments or surveys, or research with specific statistical models;
- Citations: you can assume that publications that many others refer to are important in the field.
The fifth step is a forward search, starting from the small selection of publications that are most relevant. What happened after the last comprehensive literature review was published? You can find those by searching for publications that cite the literature review. In Google Scholar you can easily find those by clicking on ‘Cited by …’ below the first three lines of the abstract. Once again, set a high bar. Select only those publications that fit your criteria.
Figure 13. Interesting papers and those of key importance. Source: René Bekkers
The sixth step is to find related research. In the first small selection of publications you will find references to previous research. What are the key publications? In Google Scholar you can easily find related articles by clicking on ‘Related articles’ below the first three lines of the abstract. You can also use CoCites to find similar articles.
3.4.2. Reading articles
When you are collecting previous research for your literature review, never start with reading the paper in full. If you fully examine each and every object that you find in the storage locker, assessing all of its properties, you will never finish. You’re much better off making a quick judgment of whether you can use it, and if so, setting it aside for further inspection later. So when you get a large number of search results, use a similar approach. First look at the title of a paper and the key words, and then examine the abstract. If you get the impression from the abstract that the publication is not (very) relevant, put it at the bottom of your pile. Find the most recent literature review on your research problem and start with reading this article. This gives you an idea of the state of the art in the literature at the time of writing. Pay special attention to the final sections of papers, which often contain a set of recommendations for future research. Especially if the paper is relatively recent, it is unlikely that anyone has executed these plans.
When you do get to read an article in full because it is in your small pile of most relevant publications, it is useful to structure the reading. I often do so by scribbling acronyms in the margin. First identify the research question (RQ) that the paper answers. Next, identify the theories and hypotheses (H1, H2…) that the paper discusses to answer the research question. Next, identify the variables in the analysis: the dependent variable (Y), independent variable (X), Mediating (Med) and Moderating (Mod) variables. What data do the authors use: when and where are they collected, and how many observations (n) are included? What kind of analysis do the authors conduct (e.g., OLS, Fixed Effects models), and what are the results? Finally, which issues limit the validity and reliability of the results?
Keep a log of these elements in a table, with a column for each of these elements.
Authors
|
Year
|
DOI
|
Theory
|
Y
|
X
|
Med
|
Mod
|
Data
|
n
|
Analysis
|
Result
|
Limit
|
3.4.3. Include references
Write a full reference for each of the publications that you have read. There are many different styles of references. The APA style is one of the most commonly used styles. You can save a great deal of work by organizing your references in a reference manager software package, such as Zotero.
A reference consists of at least four elements:
1. Author; 2. Year of publication; 3. Title of publication; 4. Where the publication can be found.
These elements should be included in references of all types: journal articles, books, reports, presentations, blogs, op-eds, presidential addresses, prize lectures, websites, and so on.
Always provide a list of references at the end of your thesis, also when your text is still ‘work in progress’, and when you have not yet cited all references in the text. Make a separate list of references to be included. This allows your supervisor to see whether you have found relevant publications that you have not yet worked into the text. You may also want to keep a separate list of publications that you have not yet read or included in your thesis text. This allows your supervisor to think along and suggest additional publications.
Your reference list is a single list of sources, in alphabetical order. Do not create separate categories for ‘books’, ‘articles’ and ‘websites’. Make sure that in the final version of your thesis the reference list contains no references that you have not cited in the text. Also make sure that the reverse is true, and that all references in the text also occur in the reference list.
Make sure you have read all the publications you refer to. Avoid including references to publications you have not read. If you think that a study you have read about in another study is so important that it deserves a mention in your text, make an effort to find it. Leave it out if you cannot find it. In the worst case, if you know that a study is important but you cannot get it, refer to a study as “Cited in: [author (year) mentioning the gem]”.
It is a good principle to refer to the source of statements. When the same reference is underlying an entire section, it is enough to include the reference only once.
3.5. Writing your theory section
Your theory section should provide the hypotheses that you will test in your empirical research. Hypotheses are to be preferred above ‘conceptual models’. A concept does not explain anything, it merely captures or describes a phenomenon. Whether that phenomenon or relation actually occurs is an empirical issue that can be settled through research. A definition is an arbitrary agreement about the meaning of a certain word. If it is useful for your readers (see 2.2.2 above) discuss definitions in your introduction. Avoid talking about definitions in your theory section. Instead you should formulate hypotheses.
A hypothesis is a predictive statement about facts before you know them. A hypothesis is not a question. In a causal model, a hypothesis is a statement about the relationship between two variables. A hypothesis is a statement you can test; a definition or a concept cannot be tested. It cannot be true or false. Avoid HIDING: including a Hypothesis In a Definition.
The causal model graphically displays the hypotheses of your thesis. In your theory section, work through your causal model from left to right, or from right to left. Each arrow in your model represents a hypothesis about the relationship between two variables.
For each hypothesis you write a paragraph of text on which the hypothesis is based. The paragraph typically consists of the following three elements:
- The paragraph starts with an explanation of the argument from a theory about the influence of X on Y. If there are multiple theories about the influence, identify them and contrast the predictions from each of these theories.
- The paragraph continues with a summary of the findings of previous research on the influence of X on Y. Give an overall summary: “Seven studies have tested this hypothesis, five finding a weakly positive relationship, and two finding no association.” Next, you can go in some detail about these results, with the depth of your discussion depending on the number of words you have available.
- The paragraph ends with the literal formulation of the hypothesis. This text is often printed in italics, as in the following example:
Given the above, I expect:
H1. The frequency of volunteering increases with the level of religious orthodoxy.
|
3.5.1. Constructing hypotheses
- “Can I just invent a hypothesis myself?”
Yes, you must! That is not to say you can just state a hypothesis and posit it with no argument at all. For each hypothesis, develop an argument about the sign of the relationship. Start with the argument, and end your paragraph with the literal statement of the hypothesis, as a conclusion.
The argument is more than a phrase like ‘Previous research has shown that X is positively related to Y’. Obviously the results of previous research include important information, but they are not an argument for a hypothesis; they may support a specific argument about why X influences Y.
Also the basis for a hypothesis is more than the statement that you expect it to be true ‘because it is logical’ or that it is ‘common sense’. Neither is it enough to summarize previous research supporting the hypothesis. A hypothesis may not have been tested at all in previous research. It is not necessary for a hypothesis to be supported by previous research. What matters is whether the argument is sound, and preferably based on a theory.
A proper argument takes the form of a syllogism. The syllogism is a logical form consisting of a General Law, an assertion about specific Conditions, and a Hypothesis. The Hypothesis is the conclusion drawn from the combination of the General Law and the assertion about specific Conditions.
An example of a general law is: the stronger a person is attached to a group, the more likely that this person follows the norms in this group. An example of a condition is: church attendance indicates attachment to a religious group. The resulting hypothesis is: the higher the frequency of church attendance of a person, the higher the likelihood that this person follows the norms within the church. You can test this hypothesis for different forms of behavior that religious groups have norms about, such as monetary contributions to the group, or voting behavior. Additional conditions specify these norms: religious groups proscribe that their members should contribute time and money to the benefit of the group.
Sometimes there are valid arguments for a positive as well as a negative relationship between two variables. In that case try to reason which direction is the strongest. The empirical test will tell you which effect dominates. If there is no way to tell which one is strongest, consider phrasing two alternative hypotheses.
In your causal model some arrows are missing, even though the empirical association between the variables are positive. These are spurious relationships. When you work through your model, also explain why some arrows are missing, and why the relationship is spurious. The argument typically takes the form of an omitted variable. An omitted variable is a variable that has an effect on the outcome, but is not included in the model. It is sometimes represented by the letter Z. In the causal diagram in Figure 14 I use the letter U to remind you that it is an unmeasured factor.
Figure 14. Causal diagram example: omitted variable bias
In the most extreme case of omitted variable bias, the relationship between X and Y is due to the fact that X and Y are both the result of U, while there is no causal effect of X on Y. This happens in the diagram above: the relationship between X and Y is dotted. In this case, U is called a confounder. In a weaker case, an omitted variable or a set of omitted variables are responsible for some of the relationship between X and Y, but not all. In this case, including the variables that were previously omitted in the analysis turns them into measured confounding variables or control variables. Adding them may reduce some of the relationship between X and Y, but not completely eliminate it. The result of adding omitted variables may even be that the relationship is not affected. In this case, the omitted variables were not actually confounding the relationship between X and Y.
3.5.2. Formulating hypotheses
Examples of hypotheses displayed graphically in Figure 8 are:
- Protestants have a higher frequency of church attendance than Catholics. [Arrow A in Figure 8: a dichotomous independent variable and an ordinal dependent variable]
- The higher the frequency of church attendance, the higher the likelihood of volunteering. [Arrow B in Figure 8: an ordinal independent variable and a dichotomous dependent variable]
- Altruistic values increase with the frequency of church attendance. [Arrow C in Figure 8; two ordinal variables]
3.5.3. Pitfalls in formulations of hypotheses
Common pitfalls in the formulation of hypotheses are the following:
- The use of the word ‘important’ and ‘role’. If you say that gender plays an important role in charitable giving it is unclear what your expectation is. When you find yourself using these words, reformulate your hypothesis such that it is clear to the reader how you are going to test it and what you expect the result of the test to be. For example, your hypothesis could be that women are more likely to give than men, particularly to health and basic needs.
- The failure to specify a direction: “Gender is related to giving”. A better formulation would be: “Women give more often than men but lower amounts”.
- The use of ‘data language’, such as variable labels: “PROT is positively associated with ATTEND” (representing Arrow A in figure 8). A better formulation would be: “Protestant attend church more often than members of other religious groups”. By the way: the use of data language in the description of your results is also a bad idea.
Suppose you would like to support your hypothesis with the results of a lot of previous studies. One way to do this is to write: “As many previous studies have shown, …. ”. A better way to do this is to list a number of the previous studies after the first part of your sentence: “As many previous studies have shown (e.g., author 1 (year), author 2 (year), …. ”.
- “Can I posit a hypothesis when there is no previous research on it?”
Most certainly, yes. A hypothesis follows from a theory. It may have received support in previous research, but is also possible that no one has tested it before. It is also possible that you’ve been searching for previous research using the wrong keywords, that is: using lay terms that are not used in academic research. If you’re sure that no one has tested your hypothesis before, you have an argument in favor of the scientific relevance of your study.
3.6. Quality of Research
When you are writing a theory section, it is tempting to review the literature by summing up the findings of previous research in an uncritical manner. This is in fact a good start of your literature review. A crucial next step, however, is to review the results of previous research in a critical way.
It may seem presumptuous to criticize established scholars, especially if you are an undergraduate student writing a thesis. But it is very important to be aware of the possibility that published research may be sloppy, contains mistakes, faulty reasoning, weak evidence, or in the worst case: it may be entirely false. You may have heard people use the expression ‘top journal’ to express their confidence in research published in certain ‘high impact’ journals with high prestige. However, it is very important to always remain critical of previous research, regardless of the prestige of the outlet in which it was published, or the prestige of the author. We will return to this in the next chapter.
How do you know whether you can have confidence in published research? Instead of relying on the prestige of the outlet, think about the claims in a research paper, and ask yourself the question: how do the authors know this? A rule that sets the bar quite high, but is very useful for a critical perspective is that if something seems too good to be true, it usually is.
The results and conclusions in published research are based on the nature and the quality of the design of the research. Have a close look at the research design. Is the design suitable to answer the research question? Pay specific attention to causal inference: to what extent does the research design allow for causal inference? Is it the best possible research design? If so, you can have more confidence in the results. We will discuss research designs in section 4.2.
Second, have a look at the data and methods. Can you actually check the data? Are they openly accessible? Or is the description in the published research paper the only source you can study? Are the codes and procedures used to analyze the data available for re-analysis? Or is the description you can read in the paper the only way to check the results?
You can evaluate the quality of data and methods in at least three respects:
- Sampling: which units were selected for the study and why?
- Reliability and validity of measures: to what extent are the measures reliable, accurate and representative?
- Replicability and replication: to what extent have others checked the research?
This list is not only good for a critical discussion of previous research, but also a list of potential limitations of your own research. In your discussion section, discuss the limitations to your findings by revisiting these aspects of the quality of research. There are many more issues to the quality of research than I can discuss here. You can use the checklist in the appendix and read more in Bekkers (2016). In criticizing previous research, be polite. You are not at war. Criticizing a previous study only after you have read it closely.
The use of less stringent data collection methods and statistical tests leads to a higher likelihood of false positive results. To avoid false positives, more stringent research designs are to be preferred. More about this in the next chapter.
4. Designing your research
The contribution of a study hinges upon its research design. To improve your research design, I offer four rules. First, the design of the research should allow you to answer the research question. Second, the data should provide sufficient coverage of the population you seek to make statements about. Third, the measures should be valid and reliable. Fourth, the tests you conduct should be as stringent as possible. Before we go into these four rules, let us revisit the rule we’ve seen before: work in the right order.
4.0. When to design your research
Design your research after you have identified the weaknesses in previous research, and before you conduct it.
After you have conducted the literature review you know the weaknesses of previous research. When you go over the limitations discussed in previous research, you know which problems you want to avoid in your own research. To some extent these weaknesses may be unavoidable, or difficult for you to repair. If you are allowed to work with existing data, use the best possible source of data you can lay your hands on. Ask your advisor for suggestions on existing data sets that do not have commonly identified weaknesses. Don’t take the advice for granted though: ask critical questions about the quality of the datasets that your supervisor suggests. We’ll go over some of the most common problems in research design in this chapter.
Think hard about the best possible design of your research before you actually do the research. Preregister the choices you make in the collection and analysis of data. Preregistration forces you to think critically about these choices. Raising the bar for the quality of the research prevents disappointing conclusions. You would like to avoid are that you were not able to answer your question for methodological reasons. Examples of such disappointing conclusions are: the sample analyzed (students) is not representative of the target population (humanity); the dataset analyzed did not contain measures of the main concepts in the theory; the measure of the dependent variable refers to a period before the period that the measure of the alleged cause refers to; or the measures do not capture the concepts that you intended to measure. We will go into issues of sampling and measurement in the next sections. But first let’s discuss the kinds of research questions that various research designs allow you to answer.
4.1. Align your research design to your research question
It is crucial that the design of your research allows you to answer your research question. You want to prevent the situation that you have conducted your study and have to conclude that the data or measures did not allow you to answer the research question. That is why it is important to align your research design to your research question. A common typology (De Vaus, 2001) makes a distinction between four types of research designs: the case study, the cross-sectional study, the longitudinal study, and the experiment. The table below shows the key characteristics of the four designs and their use.
Design
|
Case study
|
Cross-sectional study
|
Longitudinal study
|
Experiment
|
Characteristics
|
In-depth description of one case through natural observation
|
Comparison of units at one point in time through natural observation
|
Comparison of units at multiple points in time through natural observation
|
Comparison of units in multiple groups, at least one through manipulation
|
Sign
|
O
|
|
|
=
|
X X
|
Useful for statements about
|
Situations at one point in time
|
Associations at one point in time
|
Trends over time
|
Consequences of a cause
|
Prototypical research question
|
How do people Y?
|
How are X and Y associated?
|
How does Y develop over time?
|
To what extent does X cause Y?
|
Case studies can be used to answer exploratory and descriptive research questions, and they can generate leads for potential explanations (see section 2.4.5). Sampling procedures are very important in this case when you want to generalize your findings to a broader population. If you use the case study method, it is crucial to think about the rules you will apply for the selection of your cases (Seawright & Gerring, 2008). Selecting a group of ‘successful’ cases and contrasting them with ‘unsuccessful’ cases for instance helps you draw up a list of leads to potential causes (see section 2.4.5), but it does not generate a representative sample of all cases.
A case study is hardly ever suitable to provide stringent evidence on causal questions. An example of a research question you cannot answer with a case study is: “To what extent do partnerships between corporations and nonprofit organizations solve social issues?” By studying a case of a successful partnership such as the development of the AstraZeneca vaccine against COVID-19 you may learn a lot about the collaboration between Oxford university and the pharmaceutical company AstraZeneca, but it remains unclear to what extent partnerships work. If you’re interested in this particular partnership, put it in the research question so that your case study aligns with it. Your revised research question could be: “How did the partnership between Oxford University and AstraZeneca develop and successfully produce a vaccine?” This is a purely descriptive question.
You should be dissatisfied with this question because many studies have been published already suggesting ‘success and failure’ factors for cross-sector partnerships (Selsky & Parker, 2005; Koshmann, Kuhn & Pfarrer, 2012; Babiak & Thibault, 2018; Clarke & Crane, 2018). So in addition to the descriptive question you could ask: “Which features of the partnership between Oxford University and AstraZeneca are inconsistent with theories on cross-sector partnerships?” With this focus on inconsistencies, you may learn about conditions in this particular case that invalidate insights from previous research, or indicate boundary conditions in which insights from previous research do not hold. This is a better approach than to ask: “Which features of the partnership between Oxford University and AstraZeneca are consistent with theories on cross-sector partnerships?” With such a positive focus you may miss the opportunity to learn from anomalies (see section 2.5.3).
If you’re generally interested in partnerships or want to test theories about it, design your study to collect data on a larger number of partnerships. For instance, you could design a survey asking corporations about their experiences with partnerships involving nonprofit organizations. This is an example of a cross-sectional design. You could also study the annual reports of a sample of corporations to see whether they mention partnerships with nonprofit organizations. The data could tell you what kinds of corporations engage in which kinds of partnerships. Also they may indicate to what extent the corporations claim that the partnerships were successful. This design may be more informative than the single case because it tells you something about a larger population of cases.
However, you would still not learn much about the effects of partnerships from the surveys or annual reports, because you do not observe the counterfactual: what would have happened if the corporation had not engaged in this partnership? At the very least you need a sample of corporations that do not engage in partnerships. Consequences of partnerships should be more prominently reported by corporations that engaged in them than among those that did not. It would be better still to also collect data on failed partnerships. Because corporations are unlikely to describe their failures in annual reports you may need to design alternative data collection strategies to get information about them. Even in surveys, however, respondents may be reluctant to admit that they made mistakes at work or talk about the failures of colleagues. We will discuss strategies you can use to get more truthful responses below in section 4.5 on reliability and validity.
Because it is so difficult to get good quality data that are informative for the original research question, it may be better to formulate an alternative research question on partnerships. For example: you may ask what kind of corporations are more likely to engage in partnerships than others, and how they evaluate them.
4.2. Causal inference
When you use terms like ‘causes’ and ‘consequences’, ‘impact’, ‘effects’, or even when you say that something ‘increases’, ‘amplifies’, ‘enhances’, ‘reduces’ or ‘hinders’ something else, you make statements about causality. The question you should ask yourself when you use such terms is: does the research design actually allow for causal inference? Some types of research designs are better suited to answer causal questions. Let’s discuss the possibilities for causal inference in the four designs, starting from right to left.
Experiments. Strictly speaking, causal inference is only possible by using experiments in which participants are randomly assigned to treatment and control conditions. Think of an experiment as a randomized control trial (RCT) in which drugs are tested. If you have the possibility to design an experiment to answer your research question, seize it. Make sure you use a manipulation that is effectively altering the cause you are after – and only this cause, not others. You do not want to conclude that something in your experiment worked, but you do not know what. So use a clean manipulation of only one cause.
Also you want to do better than conclude that your manipulation worked, but you do not know why. Think about the variables mediating the effects of your manipulation, and measure these. When to measure the mediating variables is a bit tricky though. If you measure something, you easily make participants in your experiment aware of it, and you want to avoid this awareness to affect the behavior of participants. You would rather have your participants remain blind to your hypotheses. This is also the reason why the manipulation check – which tells you whether the participants actually swallowed your manipulation – is generally conducted after all other relevant measures in the experiment have been taken.
For the majority of explanatory research questions you cannot randomize participants in different conditions. For instance, if you have a question like ‘What is the influence of divorce on happiness?’ you will not be able to make some people experience the treatment (divorce) and withhold the treatment from others (remaining married or unmarried) and then observe the consequence (happiness). In these cases, you will need to make some strong assumptions to use non-experimental research designs to answer your question. The assumptions are for instance that assignment to treatment is not correlated with the outcome variable. In the example of divorce and happiness you need to assume that people who will go through a divorce at some later point in time were equally happy before the divorce as people who will remain married. If less happy people are more likely to divorce, it could be that the association between divorce and happiness reflects an influence of happiness on divorce, and not the reverse.
Other designs. If you cannot conduct or find an experiment, a longitudinal design or panel study is better than a cross-sectional design. Case studies are notoriously difficult for causal inference, especially when they have been selected on the dependent variable (i.e., a collection of ‘best practices’). Remember that correlation is not causation. There is much more to say about the potential for causal inference in various research designs and methods of analysis. These issues go beyond the scope of this text. One particularly helpful and insightful introductory book discussing rules for research is Glenn Firebaugh’s (2008) book Seven Rules for Social Research. More advanced discussion is provided by Shadish, Cook & Campbell (2002).
4.3. Data: Find Variance
It is pointless to ask a social scientist why a certain historical event happened or why a specific individual acted the way she did at a certain point in time at a given place. Social science is not rocket science. It is way more complicated. We do not examine perfectly predictable outcomes determined by only a few variables. There are so many candidate conditions and circumstances, forces and factors, genes and genomes, motives and musings, and other things that may have given rise to the event or the behavior that it is impossible to know which one is the culprit. Therefore, you need a simple system to organize the multitude of factors.
Suggestion number 1, specify units of analysis and look for variance, is the result of an often overlooked regularity in the social sciences. The regularity is that the degree of variance in the variables limits the validity of the conclusions. A research question can only be answered in a meaningful way if there is variance to be explained in the first place. This is the reasoning behind the recommendations #6 and #8 for research questions: make meaningful comparisons.
For many phenomena it can be useful to think about three types of variance, or levels of analysis:
- variance between individual units of analysis;
- variance within the units of analysis over time; and
- variance at higher order units.
In our example of figure 8, the variance between individual units would be the differences between individual citizens in their religiosity and volunteering behavior. Some individuals volunteer, and others do not. The research question about the cross-sectional variance between units would then be: do religious individuals volunteer more, and if so, how can this difference be explained?
The variance over time is represented by individuals moving into and out of the volunteer work force, and increasing or decreasing their level of engagement, i.e., spending more or fewer hours. The research question to be answered here would then be: do religious individuals start to volunteer more often, quit less often, and are they more likely to increase their engagement than non-religious individuals, and if so, why?
The variance in higher order units refers to a higher level in which the individual units of analysis are nested. Individual units can be located within higher order units at various levels of aggregation, such as households, corporations, parishes, municipalities, counties, or larger regions such as countries. An example of a research question about variance at higher levels is to what extent individual volunteering behavior is correlated with the volunteering behavior of other individuals in the same household, or how the number of blood donors in a municipality affects the likelihood that individuals start to give blood.
To structure your thinking, the three level ABC model is a useful tool (Bekkers, 2013; see Table 3).
Table 3. The 3 level ABC model
A good way to get to a list of variables of interest for your research is to start with the actor model we discussed earlier. Using the actor model you can identify the actors at the different levels of analysis that you need to take into account. In many cases, you will get to actors at three levels: the micro-level of the individual person, the meso-level of the organization or region in which the individual is embedded, and the macro-level of the country. At each level, it is useful to think about three types of variables: Antecedents, Behaviors and Consequences (ABC). Behaviors are the things that actors do that you want to explain. Antecedents are potential causes; they precede the behavioral outcomes. Consequences are the results of the behaviors you seek to explain.
4.4. Sampling
When creating your study or evaluating the quality of previous research, pay attention to three aspects of the sampling procedure: (a) the composition of the target population; (b) the size of the sample, and (c) the representativeness of the sample with regard to the target population.
4.4.1. Does the sample provide good coverage of the target population?
Always specify the target population of your study. The target population is the universe of objects, situations or actors that the results should be informative about. What is the population that you want to make claims about? The sample you analyze should represent the target population as much as possible.
If you use date collected by others, look for statements about the target population, and which rules were followed to get to a representative sample of that population. In reports about experiments, authors often leave the target population unspecified. This means that the authors assume that the results based on less than a hundred students from their own university are representative for mankind. This is typically not the case: experiments often use convenience samples of ‘WEIRD’ participants: students from universities in Western, Industrialized, Rich and Developed countries (Henrich, Heine & Norenzayan, 2010). In addition to a description of the target population, look for a constraint on generality (COG) statement (Simons, Shoda & Lindsay, 2017). If you collect data yourself, discuss the limitations of generalization.
- “How many observations do I need for my data analysis?”
The more the better. Given a certain target population, a larger sample is usually better
Figure 15. Sample size decision rule
4.4.2. Is the sample large enough?
As a rule, larger samples are better than smaller ones because larger samples increase the statistical power to detect existing relationships among variables. There is no way you are going to be able to generalize from one case study to other contexts. In practice, time and money limitations restrict the possibility to collect data among large samples of observations. That is why you should conduct a power analysis before you start collecting data. Start with the smallest effect size of interest, and determine the number of observations required to detect it (for guidance: see Lakens, 2021; Perugini, Galluci, & Costantini, 2018).
An overwhelming majority of publications does not specify such an a priori power analysis. In most cases the number of observations in such studies are determined by funding limitations, practical circumstances or rules of thumb such as 50 observations per cell or 15 interviews. These factors have produced underpowered samples that do not allow for robust generalizations. Keep this in mind when you read previous research. The law of large numbers implies that small samples are more likely to produce chance findings. In addition, Small-n studies such as laboratory and field experiments with strongly significant results may have been ‘p-hacked’ – the non-significant results are not shown (Simonsohn, Nelson & Simmons, 2014).
While larger samples are generally to be preferred to smaller samples, there is also a downside of large samples: even very weak relationships will easily be significant. You may get impressed yourself by the many stars for significant relationships. Regardless of the size of the sample, however, the strength of a relationship (sometimes called ‘effect size’) is more important than its significance. Some (Ziliak & McCloskey, 2004) even say that if a relationship is not sizeable, significance does not matter (‘no size, no significance’). In any case, a strongly significant difference between males and females of one tenth of a standard deviation in a sample of 3 million individuals is less impressive than a marginally significant difference of one and a half standard deviation in a sample of 1,000 individuals. Thus the second rule is substance outweighs significance.
With small sample sizes, statistics can be misleading because they suggest a precision that is strongly sensitive to sampling composition and particularly to outliers. If you have a small sample size, reporting the proportion of that sample that has a certain characteristic is overprecise. As a rule of thumb I suggest you avoid publishing proportions and other derived statistics based on a number of observations lower than n = 15. When you have more observations, but fewer than 250, still exercise caution. Correlations stabilize roughly after 250 observations (Schönbrodt & Perugini, 2013).
In multilevel analyses, the ‘more is better’ rule applies even more forcefully. A rule of thumb is that at least 25 observations are required for even the most simple linear models (Bryan & Jenkins, 2016). At this number, however, the variance at the higher level is still easily overestimated, and at least 50 observations are required to reduce this bias (Maas & Hox, 2005).
4.4.3. Is the sample representative of the target population?
When you work with a sample, specify the extent to which the sample represents the target population. In most cases, the representativeness is unknown. Reports on survey research data often describe samples as ‘nationally representative’. The question you should always ask is “Representative with respect to what?”
The rule here is that variance counts. The results of a study do not only depend on the size of the sample, but also on the variance in both the outcome as well as the predictor variables. Ask yourself: what parts of the target population have not been included?
To some extent, samples are not representative of the entire population because some parts are excluded by the design of the sampling frame: the institutionalized population and those who do not understand questions are typically left out. This is called coverage error. The imprisoned population, the rich, the very sick, mentally challenged, and those who do not speak the dominant language in a country are less likely to be included in samples.
In addition to coverage error, a second source of error is sampling error. When participation in interviews, surveys, or experiments is voluntary, samples of participants are typically consisting of individuals with above average intelligence, health, and civic-mindedness. As a result, those who are easier to reach and more willing to help science are overrepresented. Non-voters, citizens in remote areas, and persons in areas with inferior internet connectivity will be less well represented. When you work with data that others have collected, examine how much effort has been made and which strategies have been used to mitigate such risks.
As a rule, snowball or quota samples are not representative. Typically, samples in survey research are weighted on a few key demographic variables for which the true values in the population are known from registers such as gender, age, and place of residence. However, keep in mind that this procedure may yield highly inaccurate results if the weights are very low or high. Also bear in mind that non-response may be selective. If participants are selected based on their interest in the topic of the study, or on some other characteristic that is related to the independent or the dependent variable, the results are likely to be biased. This complicates accurate testing of hypotheses.
Avoid sampling on the dependent variable. If you’re a fundraiser and you ask a sample of donors why they are donating to your organization you will not learn much that helps you to recruit new donors. It will be more helpful to ask non-donors who considered donating why they chose not to do so, or to ask previous donors why they stopped giving.
As a general rule, looking only at successful cases results in survivorship bias, which can totally distort your findings (Brown, Goetzmann, Ibbotson & Ross, 1992). A somewhat milder form of looking at successful cases emerges from selection into the study based on factors that also influence the dependent variable – also known as collider bias (Elwert & Winship, 2014).
The issue of representativeness is particularly important in case study research. If you can only study a few cases, it is often impossible to select a set that is representative of all existing or possible cases. Therefore cases are often selected based on the value of the dependent variable, as in a study on the ‘best practices’ in a certain field (Seawright & Gerring, 2008; Gerring & McDermott, 2007). They can still be informative, especially if you ask informants about contrasting cases. When you speak to representatives of best practices, you could ask about decisions at crucial events that contributed to success: “why did you become a success, while others did not?” You can also ask about counterfactuals: “what practice, if taken away, would destroy your success?” Note that you can also ask these questions to representatives of worse practices.
4.5. Reliability and validity of measures
The measurement instruments used in research should be reliable and valid. The reliability of a measurement instrument is high when the reapplication of an instrument results in a value that is close (ideally identical) to the first value. The validity of a measurement instrument is high when the instrument yields a measure of the phenomenon it is supposed to measure.
Figure 16 illustrates the difference between reliability and validity. Assuming darts players all aim for bull’s eye, some players do better a better job using their body (arms, eyes, brains and will power to stay focused) as an instrument than others. The best darts players throw a pattern like the one in the bottom right panel. Players consistently throwing darts in a place other than bull’s eye show a high level of reliability – applying the same instrument gets them similar results. The reliable but not valid instrument shown on the bottom left is better than the top left instrument, which is not reliable but also not valid. The instrument on the top right is a bit better, if you have the option to use it enough times – the ‘average throw’ would be exactly in bull’s eye, but every single attempt is off.
Another analogy is the thermometer. If a parent thinks her child has a fever because the child looks pale she can touch the child’s forehead to feel how warm it is. This is a first measure of the child’s temperature. Suppose the child feels warm. Using a thermometer will then give another (and quantitative) measure of the child’s temperature. The thermometer – assuming it is accurate – could confirm the parents’ first reading, or perhaps disconfirm it and reveal that the child does not have a fever. The original measure would then be a type I error. The type II error, not detecting a fever while the child does have one, could occur if the parent and the child are both feverish. The child being warm could go unnoticed if the parent is warm too.
The reliability of specific measures increases with the number of data points used to create the measure. Therefore it is typically better to use multiple instruments to measure the same phenomenon. Survey and experimental research often include scales consisting of multiple items rather than a single question. The commonly used Cronbach’s Alpha coefficient gives you an impression of the reliability of a scale. Keep in mind though that the Alpha coefficient almost always increases with the number of items used, even if they are contributing little to the reliability of the measure (Cortina, 1993). This is a result of the definition of Alpha. Also you should know there are no absolute thresholds for what is an acceptable degree of reliability. As a rule of thumb, many researchers use values such as .70. With only three items, however, a value of .60 is pretty good, but with six items, the same .60 indicates a low level of reliability. With only three items, .80 is excellent, but with six items it is merely ‘good’. Using more items typically has decreasing marginal utility. Adding a fourth item to a scale of three tends to increase Alpha more strongly than adding a ninth item to a scale of eight.
The validity of measures is higher when they are not clouded by other influences. Common problems in survey research are that respondents fail to report accurately about their behavior and give more positive answers to hypothetical questions than to questions about facts. Observational measures of behavior are to be preferred over self-reported measures. Factual questions (e.g., ‘Did you give to a charitable cause in the past month?’) are to be preferred over hypothetical questions (‘Would you give to a charity if asked?’). The problem that respondents report socially desirable attitudes and behaviors has often been studied as a ‘response bias’ (Meehl & Hathaway, 1946; Crowne & Marlowe, 1960). However, it is clear that this tendency is not a uniform personality trait with strong effects on different behaviors (Parry & Crossley, 1950). It is dependent on situational characteristics and on other personality characteristics. The current consensus is that measures of ‘social desirability’ reflect both substance and style, and researchers should not include them to correct responses to other questions (McCrae & Costa, 1983; Connelly & Chang, 2016). A credible guarantee of partial anonymity (Joinson, 1999; Lelkes et al., 2012), a forgiving introduction (“For understandable reasons, some organizations find it difficult to partner with…”), asking indirect questions (Fisher, 1993) and several other techniques may get you more truthful responses (Krumpal, 2013).
In the example of partnerships we discussed in section 4.1 you could approach a sample of nonprofit organizations to tell you what works in partnerships with corporations, and what went wrong in failed attempts. In the best case, you survey pairs of partners, who report about the partnership as well as about each other (Kelly & Conley, 1987; Robins, Caspi & Moffitt, 2000; Watson, Hubbard & Wiese, 2000).
4.6. Replicability and replication
The discussion of the reliability of measures in the previous section also applies to studies as a whole. A study is better if its results can be replicated in a follow-up study. If a paper reports surprising findings, look for replications of the research. There are various types of replications, as indicated in Table 2 (based on Helmig, Spraul & Tremp, 2012 and Clemens, 2017).
In case the same hypothesis is tested in different ways in different data sets, the aim is in the bottom row of Table 2 on the right, called generalization: do new tests reveal similar results across different samples? Finding similar results using identical measures and procedures but different datasets, e.g. with a different sample, as in the bottom left cell, demonstrates reproducibility (Open Science Collaboration, 2015). Within a certain dataset, using different ways to test a hypothesis, for instance by adding control variables, excluding some observations or using different statistical analyses, a result may prove to be more or less robust (top right). Finally, results of research should be verifiable (top left): repeating the analysis of the same data using the exact same procedures should produce the exact same results.
Research should be reported such that replication is possible. The sampling of participants, measures used, construction of variables, treatment of outliers, the analyses conducted, and robustness checks should be reported in such a way that any researcher with access to the raw data or with resources to collect new data can replicate the study. Did the authors take this quote by Einstein to heart, engraved at his memorial at the National Academy of Sciences in Washington, DC?
Table 2. Four types of replication
If it is not clear to you which decisions the authors made in the design of the research (and why) the study is more difficult to replicate. Note that sometimes details on the research design are described in supplementary materials posted online.
If you’re reading articles reporting experimental results from multiple studies, it is a good idea to use the p-curve web app (http://www.p-curve.com/app/) to see how likely the results are. You might find that the results reported in the paper are ‘too good to be true’, or ‘p-hacked’ (Simonsohn, Nelson, & Simmons, 2014). If the results are too good to be true, this does not imply that the authors deliberately engaged in research misconduct (RM) or questionable research practices (QRP); it may also the be the case that the findings are a ‘lucky shot’, a statistical fluke that cannot be replicated. Such results are more likely to occur when the statistical power of the research design is too low. Increasing the number of observations is a general strategy that increases statistical power.
Obviously, you should apply the principles discussed here to your own research and live by Einstein’s commandment. Make sure that your research can at least be verified. Compare science with cooking. You should think of the documentation of the steps you took in your research as if you are writing a recipe. If you omit important details, like the temperature that the oven should have, or the duration of the bake, it is not of much use to tell your readers to know which ingredients went into the cake. Your job is to make the next baking attempt another success, just like you had it.
Figure 17. Practice and duty in reproducibility
Imagine yourself trying to bake that fantastic cake again, five years from now. Especially if you have a complicated recipe, you better write down the measures of the ingredients, the details of your oven, pots and pans and the utensils you used. Unlike many famous cooks who keep secrets or the Swedish chef from Sesame Street who has a habit of erratic working with random objects, a good scientist is completely transparent about every step in the research. Transparency ensures the best conditions for successful replication. If you compare conducting tests in the social sciences with cooking, the science is rather dull. It is a cold-blooded and rational application of techniques. There is no creative artistic involved. You do not want to be like the cook saying ‘I do not remember what I did’ when asked how she got to the award winning dish.
4.7. Testing: Design your test to be as stringent as possible (BSTAR)
When you design a set of tests of your hypotheses you can often choose between many different types of tests that vary from ‘loose’ to ‘strict’. For instance, when your hypothesis is that volunteering contributes to health, the finding from a cross-sectional design that volunteers in interviews report feeling healthier than non-volunteers is a loose test (Bekkers & Verkaik, 2015). This is because your finding can also be explained from the reverse causal direction, such that health contributes to volunteering. The finding from your loose test is much less convincing than the finding from a longitudinal survey that people who volunteer live report fewer chronic illnesses and ultimately live longer than non-volunteers. The best evidence, however, would come from a field experiment with repeated measures showing that giving people in a treatment group additional opportunities to volunteer keeps them healthy and alive for a longer period than people in a control group who were not given additional opportunities.
As a rule, the more stringent test is more informative. You may not be surprised that tests of the more stringent kind in the example above are much less often positive than loose tests. Generalizing this finding, I have introduced Bekkers’ Stringent Test Administration Rule (BSTAR): the more stringent the test, the better. If the result survives, it is more robust, and less likely to be a chance finding. A more stringent test provides you with a more informative result. The rule is similar to the Stainless Steel of Evaluation (Rossi, 1987): “the better designed the impact assessment of a social program, the more likely is the resulting estimate of net impact to be zero”. To give just one other example: a massive study on the effects of Facebook ads (Gordon, Zettelmeyer, Bhargava & Chapsky, 2017) showed that observational methods yielded threefold overestimations in half of the campaigns analyzed.
On the positive side: if your hypothesis has withstood a more stringent test, the result is less likely to be a false positive. Compare testing theories with a high jump competition in athletics. When the bar is set too low, we do not learn very much about the maximum height a jumper can clear. Only when the bar is set relatively high we learn which jumper is the best one in the competition.
When you have more observations at your disposal, and measures with higher reliability and validity, it is more likely that a null finding (no relationship) or a negative result (contrary to your hypothesis) is actually true.
Usually, there are multiple pathways from an independent to a dependent variable (i.e., from an antecedent to a behavior). It is better to evaluate multiple pathways simultaneously rather than only one. See sections 2.4.5. and 3.1 on testing multiple mediating mechanisms.
The final check on the design of your own research is to go through the bullshit bingo card (Figure 18), displaying common problems in research design and theory construction (Occamsbeard, 2014).
4.8. Meta-criteria for quality of research
Additional aspects that you can take into account when evaluating the quality of previous research are meta-criteria such as the funding source, the level of transparency, and the publication outlet in which the research appeared. Funding sources, transparency and publication outlets are associated with the level of scrutiny that a study has received. Studies funded by grants from government agencies are more likely to be of high quality than studies funded by parties that have a financial stake in the results. Studies that do not provide access to the data used, do not include the materials used, and do not provide the code for the analyses reported are not transparent. They are more likely to include mistakes than studies that rely on open data, materials and code. Studies published in international, peer-reviewed academic journals are likely to be better than published in national journals without peer review or unpublished studies.
Some academics use the rule that research that is not published should not be cited. This rule should not be used, because it contributes to selective citation of positive findings. Published research is much more likely to report positive results than unpublished research. For this reason, meta-analyses of published research are usually selective as well, and should not be taken as the most credible form of evidence. Instead, look at the design and methodology of relevant research, regardless of whether it is published or not.
When you report on previous research, always try to find attempts to replicate the research. There are interesting new tools that help you do this, such as scite.ai. Did more recent studies with similar research questions, but with different data and methods arrive at similar conclusions? Then you can be more confident that the initial findings are reliable and can be generalized. Studies that have not been replicated at all are more likely to be false positives.
A rule of thumb in the evaluation of research quality that many people use is that the higher the impact factor of a journal in which a paper has appeared, the higher the level of scrutiny a study has received. However, publication in a highly ranked, peer-reviewed, international journal does not guarantee that the research is of high quality. Even so-called ‘top journals’ struggle to keep up the quality of the research they publish (Brembs, 2018). Editors of journals with a higher impact factor reject a larger proportion of manuscripts, often without even sending them out for peer review (‘desk rejects’). Also, editors often base their decision to send out an article for peer review on criteria that have little to do with the quality of the study. Finally, peer review is not waterproof. Recently, cases of fraud have been detected even in publications in very prestigious journals such as Science. An increasing number of publications have been retracted in the past years. The number of retractions is even higher in the more prestigious journals (Fang, Steen, Casadevall, 2012). This trend illustrates the importance of an independent, critical assessment of the quality of previous research on your research problem.
A better criterion than the impact factor of a journal may therefore be the number of citations to the paper itself rather than to the journal in which it appeared. However, this metric is also difficult to interpret. Obviously, citations increase with age: older research has had more time to get cited. Also, systematic literature reviews and meta-analyses typically receive more citations than individual research reports, even though they typically do not pay attention to the quality of the research presented. Research published in larger fields, such as economics or psychology, receives more citations than research published in smaller fields, such as sociology or anthropology. Finally, research that is too good to be true may receive citations precisely because it cannot be replicated.
5. Writing the empirical part
5.0. When to write it
The first advice I would like to give you is: write the data and methods section first, before you have collected or analyzed your data. Describe the methods you will use to collect data before you start collecting your data: are you conducting interviews, surveys, or analyzing archival data? Preregister the design, for instance at aspredicted.org. How many observations will you collect and analyze? Why this number and not more or fewer? Make a data analysis plan: how will you get from raw data (interview recording, notes) to values of variables, which comparisons will you make? Describe the statistical tests – if any – you will apply before you actually apply them. Describe the rules you will apply to handle outliers. This is commitment to yourself that forces you to think more carefully about the data and methods. You can publish the preregistration to make violations of your promises even more transparent. Preregistration of your research design and materials and methods not only proves to others that you have not been p-hacking, it also creates a self-commitment to your plans.
5.1. What to report about your data and methods
The cardinal rule in the writing of your data and methods sections is that your research should be replicable (Nosek et al., 2015). Be open and transparent in the description of your research. Assume that a climatologist who knows nothing about the methods and data that you have used would try to replicate your research. What pieces of information would she need?
Right. All of them. Remember Einstein (Figure 17).
So:
- Report the procedure you (or others) have used to recruit your research participants.
- Describe all the selections you have made to get from the target population to the group of actual research participants.
- Report the order in which and the conditions in which the participants completed the study. Were they tested in a classroom, in individual sessions, at home, in the lab or in class? Who was present during the interview? What promises were made to participants about confidentiality or anonymity?
- Report the data collection mode: paper and pencil questionnaire, face-to-face personal interview, computer assisted personal interview, computer assisted web interview.
- Report the topic list for your interviews.
- Report the survey instruments you have used by referring to previous research describing them or better still: print the items in an appendix.
- Report for each variable in your causal model how you measured it. What did you do exactly with the variables from the original data file?
- Provide your data (without personal identifiers) to your supervisor and put them in a public repository, such as the Open Science Framework (OSF).
- Provide the code (SPSS syntax, Stata do-file, R script) with commands that make the data ready for analysis and produce the empirical results you report to your supervisor. Put it in a public repository.
In writing your thesis, you do not have to select which details to describe and which to omit – simply describe them all. Make all the materials you used (interview guides, topic lists, questionnaires, instructions for participants, stimulus materials) available in appendices and put them online, for instance in a project on the Open Science Framework. See the next section for a step-by-step guide.
When you are reworking your thesis into an empirical journal article, make sure you follow the guidelines and common practice in the journal to which you are submitting your article. Not all of these details are typically included in empirical journal articles; sometimes they are described in online supplementary materials, or they not disclosed at all. You will have to make selections. The journal may force you to keep only one or a few tables, and only one or a few figures. This is a bad practice that hinders progress and replicability in science. Whatever you present in the main text, make sure you do include all materials in the manuscript you submit to the journal, and include a DOI link to the preprint version. Create an ‘online supplementary materials’ appendix if possible. Certainly present all materials through a link to your project page.
5.2. How to organize your data and code
The guidelines for the organization of your data and code are based on two general principles: simplicity and explanation. Make verification of your results as simple as possible, and provide clear documentation so that people who are not familiar with your data or research can execute the analyses and understand the results.
Simplify the file structure. Organize the files you provide in the simplest possible structure. Ideally, a single file of code produces all results you report. Conduct all analyses in the same software package when possible. Sometimes, however, you may need different programs and multiple files to obtain the results. If you need multiple files, provide a readme.txt file that lists which files provide which results.
Deidentify the data. In the data file, eliminate the variables that contain information that can identify specific individuals if these persons have not given explicit consent to be identified. Do not post data files that include IP addresses of participants, names, email addresses, residential home addresses, zip codes, telephone numbers, social security numbers, or any other information that may identify specific persons. Do not deidentify the data manually, but create a code file for all preprocessing of data to make them reproducible.
Organize the code. In the code, create at least three sections:
1. Preliminaries. The first section includes commands that install packages that are required for the analyses but do not come with the software. Include a line that users can adapt, identifying the path where data and results are stored. Use the same path for data and code. For example:
use cd "C:\Users\rbs530\surfdrive\Shared\VolHealthMega"
The first section also includes commands that specify the exact names of the data files required for the analysis. For example:
use "Data\Pooled\VolHealthMega.dta", clear
2. Data preparation. The second section includes commands that create variables and recode them. Also this section assigns labels to variables and their values, so their meaning is clear. For example:
label variable llosthlt "Lost health from t-2 to t-1"
3. Results. The third section includes the commands that produce the results reported in the paper. Add comments to identify which commands produce which results, e.g.
*This produces Table 1:
summ *
4. Results. An optional fourth section contains the commands that produce the results reported in the Appendices.
*Appendix Table S12a:
xtreg phealth Dvolkeep Dvoljoin Dvolquit year l.phealth l2.phealth l3.phealth l4.phealth, fe
Explain ad hoc decisions. Document and explain your decisions. Throughout the code, add comments that explain the reasoning behind the choices you make that you have not pre-registered. E.g. "collapsing across conditions 1 and 2 because they are quantitatively similar and not significantly different".
Double check before submission. When you are done, ask your supervisor to execute the code. Does the code produce the results reported in the paper? Can your supervisor understand your decisions? If so, you are ready.
Locate your materials. Identify the URL that contains the data and code that produce the results you report. If you write an empirical journal article, add the URL to the abstract as well as in the data section. Identify the software package and version that you used to produce the results.
Set up a repository. Create a repository, preferably on the Open Science Framework, https://osf.io/ where you post all materials reviewers and readers need to verify and replicate your paper: the deidentified data file, the code, stimulus materials, and online appendix tables and figures. Here is a template you can use for this purpose: https://osf.io/3g7e5/. Help the reader navigate through all the materials by including a brief description of each part.
5.3. How to discuss your data and methods
In your data and methods section, start with a table with descriptive statistics (minimum, maximum values, means, standard deviations) for all of your variables. In the example in Table 4, the variables are grouped: the dependent variables are presented first, then the independent variables. Include not only the original variables, but also the variables you derived or constructed by taking logs, censoring certain values or imputing missing data, and taking means or factor scores for scales.
Discuss the values in the table of descriptive statistics. Compare the means and standard deviations with known population values. Demonstrate that your research sample has sufficient variance on the dependent and independent variables to derive valid conclusions.
Creating a table of descriptive statistics is a good practice that helps you identify errors in the construction and handling of variables. If a variable has a very high maximum (or very low minimum) value, you may need to think about the way you treat missing values and outliers. If you forgot to recode missing values such ‘99’, ‘99999’ or ‘-1’ or made a mistake, the table will probably reveal it if you pay close attention. You should also check whether you have observations for all units in the dataset.
In the example of Table 4, most of the variables look fine: about a quarter of your participants donated, and they gave on average a little less than half of their endowment. The factor score for empathic concern has an average of 0 and a standard deviation of 1, and the empathy induction manipulation was randomly administered to half of your participants.
However, you also see that the level of education is right-skewed: the average is much higher than the midpoint of the scale. If you get such a result, check the data and your coding. The skewness may be real, and if so, describe it. The amount donated as a dependent variable was constrained in this hypothetical experiment to a maximum of 10 – the complete endowment that the participants received. Outside the experiment, variables such as the amount donated in the course of a calendar year often contain outliers: very high values that rarely occur. In this particular dataset, one participant reported having donated €1,250 in the past year. This is a very high value relative to the average. Moreover, this particular amount by itself increases the average and the standard deviation.
Table 4. Descriptive Statistics Table (hypothetical example)
Leaving this observation in the dataset – assuming it is accurate – may strongly affect the results you obtain in a comparison of means and even a regression analysis. It is good practice to design a strategy to handle potential outliers before you collect your data and certainly before you start analyzing the data. A solution that reduces the influence of outliers but keeps them in the dataset is to winsorize them. This technique, named after the engineer and biostatistician Charles P. Winsor, reduces the original value to a prespecified value, for instance the value of the 99th percentile. The advantage of winsorizing over the elimination of outliers, also known as trimming, is that you do not lose observations from the dataset.
In addition to creating a table of descriptive statistics, another tool to detect errors and other peculiarities in the data is the graphic display of the distribution of variables. Create histograms, not only to see the skewness of variables, but also to get a sense for the range of values and to see outliers. Display your correlations in a scatterplot. You will immediately detect deviations from non-normality, find outliers and influential observations. Follow the rules you have pre-registered for handling these cases.
5.4. How to report your results
The way your results section should be written up depends heavily on the discipline in which you are working. Refer to a style guide of the professional association in your discipline (e.g., the American Economic Association, the American Sociological Association, American Psychological Association) or to a style guide developed by your institution.
Personally, I like results sections that follow this structure:
- Table I. Descriptive statistics of all variables used in the analyses below
- Table II. Bivariate analyses of the relationship between X and Y
- Table III. Multiple regression analyses of Y on Xs
Do not copy and paste the results from the output window of your statistical analysis software. They typically contain too much information.
Always start with a bivariate analysis. Table 4 provides an example of how you can report it.
Table 4. Bivariate analyses (hypothetical example)
Discuss the results along the lines of your hypotheses, for example: “In line with our hypothesis on gendered giving, women were found to be more likely to give than men. The difference is about 10 percentage points. The negligible difference in empathic state, however, suggests that empathy is not a likely explanation of the gender difference in giving. Neither is the level of education a likely explanation, as the values in the final column show.”
A good table is self-explanatory. Its title, contents, and footnotes allow the reader to understand the design and the results of the analyses without having to read the accompanying text.
Graphs are a good way to present bivariate analyses. When you plan to conduct multiple regression analyses, always inspect a set of scatter plots first, before you proceed to include control variables or test for mediation. You may discover that the distributions of the variables you are interested in are not normal. As an example, consider the plots in Figure 19 from the Datasaurus package (Locke, 2018), all reflecting the same means and correlations.
Figure 20. Datasaurus scatter plots
If the scatter plot looks like one of these, how much confidence can you have in the results of a regression of Y on X? Before you run a model with an interaction to test for moderation, graphically display the relationship you think is moderated by values of the moderator variable. If the graphs do not look too different, the regression results may be misleading.
Start your results section with the most simple description you can think of. For instance, if you are testing the association between religiosity and prosocial behavior, start by presenting simple differences between religious groups, without any covariates. If you report results of an experiment, show the distribution of the outcome variables by condition. Do not jump into analyses of variance and regressions right away, without looking at the distribution of variables.
For an example of how to report regression results, see Table 5 (taken from Bekkers & Schuyt, 2008, p. 90). The table presents odds ratios for the relation between predictor variables and the likelihood of volunteering outside church. Note that the table does not report confidence intervals for the odds ratios, as would be common in other disciplines, such as health research or economics. The table shows three columns. In the first column the denominational differences are displayed, controlling for differences in gender, age, town size, income, and level of education. The logic of the table is that in each successive model, a set of variables is added that tests a pathway of influence from denomination to volunteering. The second column adds predictors from the ‘conviction’ explanation arguing that denominations affect volunteering through social values.
The accompanying text is the following: “Church members also dominate voluntary work in non-religious organizations (see Table 5). Catholics are very well represented in this category of active citizens. Dutch Catholics may not often volunteer for church-related groups and may not be very generous, but they are very active in non-religious voluntary associations. In addition, we see that also older, more highly educated people, people living in smaller communities, and people with lower incomes are more often volunteering in non-religious organizations. The significance of size of municipality is interesting: in research from the U.S. it is often argued that differences between urban and rural areas can be attributed to the different composition of the local population (Wilson 2000; Wuthnow 1998). This does not seem to be the case in the Netherlands. Model 2 reveals intriguing findings: compared to the non-religious, the greater activity of Protestants in volunteer work outside church is due to some of their social values, but the higher volunteer activity of Catholics in non-religious organizations cannot be explained in this way. Altruistic values, and to a smaller extent also generalized social trust, increase the likelihood of volunteering for non-religious organizations. These results partially support hypothesis 4. In contrast to the analysis of non-religious giving, we find no significant relationships of prosocial value orientation, social responsibility or salience of religion on non-religious volunteering. As predicted by hypotheses 2 and 3, model 3 shows that greater exposure to requests for contributions and stronger social pressure to honor these requests promotes voluntary work outside the church. In contrast to hypothesis 1, church attendance, however, actually lowers the likelihood of participation in non-religious voluntary work. Similar findings are reported in U.S. studies (Campbell and Yonish 2003; Park and Smith 2000).”
5.5. Writing up your results
Substantial section titles are more attractive than structural ones. So instead of a title like ‘Hypothesis 1’ use a title stating what the hypothesis is about, like ‘The relationship between corruption and economic growth’. An alternative strategy is to state the question that the hypothesis is answering. In this case: “Do more corrupt countries show lower economic growth?” Personally, I like it even better when the basic finding is expressed in the title: “Lower growth in more corrupt countries”.
The same advice goes for the title of your paper. Especially when the main contribution of your piece is empirical, say what you found: summarize the main finding in the title. When the main contribution is in the data or the application of a new method, consider mentioning these in the subtitle.
One common pitfall I have encountered in theses using cross-sectional data, often from surveys, is that authors call associations between variables ‘effects’ or ‘influences’ of the predictor variable on the dependent variable. However, correlation is not causation; you cannot infer causality from an association between two variables. If you have non-experimental data, avoid the use of words that suggest causality such as ‘cause’, ‘effect’, ‘influence’, ‘result’, ‘determinant’, or ‘consequence’. Instead, talk about relations between variables, or better still: write about differences in Y between groups or categories X. For example: instead of ‘there is a positive relation between female and donation’ or ‘gender significantly affects giving’ write ‘men were found to give less frequently than females, but when they gave, they donated higher amounts’.
If you report results of regression analyses, do not merely state that a relationship between two variables is significant, but also give the reader an idea of the strength of the relationship. Remember that ‘effect size’ is a misleading term when you have non-experimental data. Only use "effect size" if you have random allocation to condition, as in an experiment.
Also remember that even a very weak relationship can be significant if the number of observations increases sufficiently (Goodman, 2008). The strength of relationships is often described using standardized coefficients such as the beta coefficients in an ordinary least squares regression. However, beta coefficients can be misleading if you have variables of different measurement levels in your analysis. Judging from the beta coefficients, dichotomous variables such as gender always seem to have less predictive value than the ordinal variables. This is an artifact of the distribution of the predictor variable: there are only two genders, while there may be many more values for the ordinal variables in your analysis, such as the level of education or household income. Therefore it is better to describe the strength of relationships by comparing the unstandardized coefficients relative to the reference group. Pick your reference group in a meaningful way - e.g. in the example of Table 5 above, the non-religious were the reference group, because they give the lowest amounts.
A general recipe for the description of the association between two variables is:
- Describe the difference in y for a one unit difference in x.
- Compare the difference in y for the extremes of x. How common are they?
- If the extremes are rare, mention that few observations are at the extremes.
- Are the y values for the extremes on the x in line with the almost extremes? Then the relationship between x and y is linear. If the y values for the extremes of x are not in line with the almost extremes, then you need to check what happens if you leave them out or winsorize them.
- Compare the association or effect size of interest with another difference. This could be one from your model, e.g. the difference between men and women, or between the top and bottom 10% of the income distribution, or with another difference that readers will intuitively understand.
Another warning is against over precision. Numbers with three or more decimals suggest a very high level of precision. However, social science research typically has a large number of limitations as a result of choices in data collection and analysis – sampling procedures, measurement of concepts, coding of variables, model specifications and estimation algorithms. Any number you provide depends on a large number of factors that make the third or more decimal essentially meaningless. The choices you make – or others have made for you – are far from perfect and sometimes outright arbitrary. The proverb here – often attributed to John Keynes but formulated earlier by Carveth Read (Ratcliffe, 2012) – is “It is better to be vaguely right than exactly wrong.”
Be concise. Use graphs to illustrate your results. As DeVaux, Velleman & Brock (2012, p.19) say: the three rules of data analysis are: 1. Make a picture; 2. Make a picture; 3. Make a picture. A figure is often more appealing than a table. Be honest in your figures though: Figure 20 is misleading.
Avoid repetition. Say things only once. That is: do not repeat what you have said before.
In other words, do not write exactly the same sentence in two different sections such as the introduction, the results and the conclusion section. Do not describe the results from a table in the text by mentioning the numbers from the table. For example, if the coefficient for the log of income in a regression predicting the log of the amount donated to charity per year is .123, do not write “Model 1 of Table 1 shows that the income elasticity of charitable giving is .123” but write “Model 1 of Table 1 shows that a 10% increase in income is associated with an increase in the amount donated of 1.2%”. Finally – just in case I am your supervisor – it may be good to know that I am allergic to references to previous paragraphs like “As we have seen before in section 4.2.2.1” and “As explained above”.
Avoid footnotes. If you find yourself putting text in a footnote, decide whether it is an important detail. If it is, put it in the main text. Perhaps you need to rewrite it to make the text from the footnote fit. If the footnote text is not important enough to be in the main text, you may as well cut it. Or move it to an appendix.
When you think you are ready with your results section, copy the text to a new document and change the font (Dillard, 2018). Print a hard copy and read it on paper. You will find mistakes you have overlooked because you have become accustomed to the text by reading it over and over again. A wlel kown pehnmenon is taht pepole fial to regocinze seplling mitsakes aftr a whle. Evn txts wtht vwls r rdbl, espcly as lng as th frst and lst lttrs are in the rght plcs.
Next, give your text to a friend for proofreading. You will have seen your own text so many times by now, that you will not easily spot omissions, mistakes and bad writing.
6. Writing the conclusion and discussion section
6.1. In conclusion….
In the conclusion section, you answer your research question, giving a short summary of the results from the empirical chapter. Repeat your research question, and make sure that you also answer it. Do not repeat the text you have just written in the results section. Summarize the results in just one sentence. A useful tool that will help you write the conclusion is the causal model from the theory section. Revisit the model, and describe the actual relationships as you observed them in your research. If you compare the causal model reflecting the results with your initial model you immediately see which hypotheses were not supported. You can even redraw your model, omitting the arrows that turned out not to be accurate, and adding the arrows that you observed. If your research question was a ‘to what extent’ question, you can add coefficients to the causal model. In most cases, the model gets more complicated.
In your conclusion section you should keep close to the facts. Do not speculate about reasons why your hypotheses were not supported. If you have an idea about why a specific result emerged that you had not anticipated, test this idea in the results section (if possible). If that is not possible, say so in the results section and include a speculation in the discussion section, not in the conclusion. Also do not write about implications of your results for theory, policy or practice in your conclusion section. This is what the discussion section is for.
6.2. Discussing your research
In the discussion section, you do two things: you discuss the quality of your research, and you discuss the implications of your research. In the discussion about the quality of your research, revisit the shortcomings of the design of your study which you have already talked about in the data and methods section. Also discuss the strengths of your research design, data and methods. The stronger the design of your research, the higher the quality of your data, and the more stringent the tests you conducted, the less likely your results can be explained as a result of its shortcomings. When you write this part of your discussion section, envision the fiercest critic you may encounter. What would be the arguments against your conclusions in your worst nightmare?
When you write about the implications of your research, envision two types of audiences: people who may want to use the conclusions of your study to change things, and people who may want to build on your research in the future. This means you revisit the arguments you made in the introduction about the societal and scientific relevance of your study. How does your research contribute to solving a social problem, help improve policy, explain anomalies, solve mysteries, open black boxes?
When you make recommendations for policy and practice, remember that your findings are essentially out of sample predictions about the consequences of a change in X, assuming that the effects on Y in the future are similar to the ones you observed in the situation you studied. You should discuss whether this assumption holds. Will the results you obtained also be valid in future situations that you have not examined? You do not want to make recommendations for future policy or practice in situations in which your recommendation is likely to result in different consequences.
- “Isn’t my research a complete failure now my hypothesis was not supported?”
No, not at all. First of all, it is good to know that you are not alone. In science, most things don’t work. All the nice results published in ‘top journals’ by glamorous professors you have relied on to construct your hypotheses may have given you the impression that hypotheses are always supported. The reality, however, is much different.
Second, have a little more faith in yourself. You had good reasons for your hypothesis, remember? Perhaps something was wrong with the way you tested your ideas. That is why typically, in the discussion section you first talk about methodological problems that may have affected the results. Scrutinize your data and methods. Discuss limitations to your research. If you were a really critical reviewer of your own work, what problems can you identify in the validity and reliability of the measures? What are the consequences of these problems for your results? If the measures would have been better, would the results have been different? In what way? In some cases, you can ‘save’ the hypothesis you rejected with an argument about the imperfections of your data and methods. Perhaps your results would have been in line with the hypothesis if the test had been better.
Do not give such explanations too lightly. They sound like excuses of the coach after a lost game, and you know what they say: “A winner always has a plan, a loser always has an excuse”. If after doing all the work you can think of obvious reasons why your data and methods were not good enough, why didn’t you think about them before? You should have used better data and methods. This is why your research design is so important. Also remember that usually more stringent tests give less positive results. In my experience, suboptimal data and methods increase the chance that you did not reject your hypotheses. Finally, when you make a case about characteristics of data and methods, spell out the complete argument. For instance, if you argue that using a convenience sample of online platform workers may be the reason why you did not observe the expected effect, explain why the participants did not behave in the way you expected. Did the workers complete the survey too quickly and were their answers not reliable or valid? Well, take the subsample of workers who took more time or provided more reliable and valid answers. If this subsample also does not display the expected behavior, your explanation is unlikely to hold. If you argue the manipulation you used in your experiment was not successful, provide results from a manipulation check, and leave out participants who failed it. If your results hold for those who successfully passed the manipulation check, your explanation holds.
After the discussion of the methodology of your research, you discuss the implications for the theories you used to develop the hypotheses. You start with a discussion of the reasons why some of your hypotheses were rejected. If these reasons are not methodological, you check whether the deduction of the hypotheses was correct. If the deductions are correct, you discuss to what extent the results of your research call the hypotheses into question and talk about the tenability of the theories and hypotheses. Go back to your theory section and construct a testable hypothesis to explain why some of your results turned out to be different than you expected. If possible, check your explanation using data. Start with the data you have at your disposal. Test the implications of your explanation with the data you already have. If you cannot test the explanation, suggest ways in which future research may do so.
Hypotheses that were supported are also worth discussing. Can they be explained by alternative mechanisms? Which alternative explanations can be ruled out by your own research? Which additional analyses of the same data could rule out alternative explanations? How should new research be designed to rule out alternative explanations?
If you found unexpected results that do not bear directly on the hypotheses that you formulated, but are interesting and worth attention, identify them. If you have space, give explanations for such unexpected results.
Finally, you suggest further research to correct the problems of your research or to find more meaningful answers. When you read previous research, pay particular attention to the paragraphs with suggestions for future research. Have subsequent studies tried these suggestions? If not, you may have found some ideas for your study.
7. Writing the abstract
Only after you have fully completed writing your conclusion and discussion section, you can begin to write the abstract. The abstract is a brief summary of your thesis that contains all essential elements. The way abstracts are written differs between social science disciplines. A useful guide is posted at the Writing Center webpage of the University of Wisconsin, http://writing.wisc.edu/Handbook/presentations_abstracts.html.
Base your abstract on a recent article in one of the top journals in your field. Locate the top journals by looking at citation scores and impact factors. A fairly universal structure for your abstract answers the following questions (adapted from Pierson, 2004):
- What is your question?
- Why did you start?
- What did you do?
- How did you do it?
- What did you find?
- What does it mean?
In case you are required to submit an abstract of your research to start the project, write the abstract such that it describes:
1.The research question;
2a. The societal and scientific relevance of the question and potential answers to the question;
2b. The theories used (#1 above);
2c. The hypotheses that you would like to test;
3+4. The research design used to test the hypotheses;
5. The results;
6. The implications of the findings for relevant theories and potential policy implications.
8. Writing the preface
When you have completed the substantial parts of your thesis, you can write the preface. This is the first section of your thesis of one or two pages, in which you describe how you stumbled upon your supervisor, your research question or your dataset (or all three at once). It is OK to tell a story (“It was a sunny day on campus…”), come up with an anecdote and write your preface in a personal style.
Also the preface is the place to thank people who have helped you with your thesis by providing data, by interpreting results of statistical analyses, or by proof reading and catching language errors. You can talk about your personal experiences in this section, but not in the remainder of your thesis.
In an empirical journal article, the preface takes the form of an ‘Acknowledgements’ section or a footnote. Make sure you thank everyone who contributed. In case your article has multiple contributors, describe the contributions of each person who contributed in an author contribution note.
9. Writing style: When in Rome…
The writing style you should use in your thesis depends first and foremost on the customs and traditions in your academic discipline. If your academic program provides you with a ‘How to write your thesis’ guide like this one, use the one provided by your institution. Excellent guides are Neugeboren & Jacobson (2005) for writing in economics and Eco (1977) for the humanities. Secondly, consult your supervisor to hear her personal preferences. If these academic customs and personal preferences run counter to my advice, let the powers that be prevail and ignore my blabla. In case I am your supervisor, I can advise you to follow my suggestions.
Despite the appeal of investigating a mystery, following leads and reopening cold cases (see 2.4), your research report should not read like a ‘whodunnit’ detective story. Do not let your readers engage in a hunt for clues about the identity of the murderer, the motive for the murderer, or the murder weapon. A good detective story hides crucial details about important elements of the case, only to uncover them with maximum effect on the curiosity of the reader as the investigation unfolds. In contrast, a good research report informs the reader right from the start who committed the crime. You present the evidence supporting the conviction, and systematically discuss all the suspicions that proved to be unfounded, and the reasons why. Rarely does a research report involve a plot twist.
Neither is your research report a chronological story of an adventure trip to the jungle that you talk about to people you don’t really know at your niece’s 7th birthday party. The readers of your research report are very impatient. Show your readers two pictures of your travel destination (max) and give them a map of where they can find it. Do not show a long series of pictures of every inch of the trail, accompanied by a story about how you got sidetracked on day 3 of the hike and how you ultimately discovered the signs back to civilization. You kept a log of your journey, and for those fellow travelers who also want to get to the waterfall in the middle of nowhere you have all the details ready, along with a list of equipment to pack and suggestions on how to avoid the swamp on day 3.
9.1. Rewrite your draft
The first time you write something, don’t care about grammar, style, and typos. Just leave them in. When you are thinking about the substance of an argument, you do not want to be distracted by cosmetic issues. In this way you can speed up the writing. After you have written a first draft, go over the text carefully. Correct the mistakes and improve the text.
When you go over your draft, check whether claims you made are sufficiently justified by theoretical arguments and previous research. In the introduction and theory section, add references to previous research that support the claims. Make sure that the text is a fair representation of the entire research. Avoid selective citation of previous research by mentioning only those studies that support a certain argument and leaving out countervailing evidence.
Screen your text for sentences who have written in the passive voice. Rewrite them as active sentences. For instance: consider the sentence “using a passive voice leaves determination of the source of the initiative up to the reader”. Rewrite that sentence as follows: “if you use a passive voice, you do not tell the reader who the actor is”. You will see that this sentence, in the active voice, is much clearer.
Rewrite sentences in which you use the same word twice, such as sentences in which you use the word ‘twice’ twice. For instance: a better alternative formulation of the sentence “Starting a sentence with the word ‘starting’ will not earn you a death sentence, but is starting to unnerve your readers.” is “You may annoy your readers if you put the word ‘starting’ at the beginning of a sentence.”
Remove brackets. Brackets (like these) signal to the reader that the content between them is not really important. Well, if the content is not important: then why include the diversion? In my experience, sentences placed between brackets are often important, but not yet thought-through. In these cases they raise more questions than they answer. So if you find yourself putting sentences in brackets, try to rewrite these sentences into the running text, or cut them altogether.
9.2. Answers to frequently asked questions
- Should I write “I” or “We”?
Can you refer to yourself as the person who formulated the research questions, constructed hypotheses, collected and analyzed the data, or should you use an impersonal expression? My personal preference is that you write in an active voice, with sentences like “I have hypothesized that…” rather than “In this study, it has been hypothesized that…”. In the discussion of results you can engage the reader by saying “In table 4, we see that…” The use of personal pronouns however is controversial, and some supervisors may be heavily opposed to it. Check with your supervisor to hear her preference.
- Should I write in the present or the past tense?
If you are describing how your research was designed and carried out, it is my distinct preference that you do that in the past tense: “The questionnaire provided 27 categories to measure pre-tax household income, as well as the options ‘don’t know’ and ‘do not want to say’. In addition, 84 participants did not provide an answer to the question.” Some style guides suggest you use the present tense (“We measure pre-tax household income in 27 categories”). Consult the style guide provided by your program and ask your supervisor what her preference is. Whatever you choose, write consistently, and use only one tense.
- Which terms should I define and explain?
When you use terms that are not commonly used or controversial you will need to define them. Do this the first time you use them. Otherwise the reader will wonder what you mean by the term, or worse: assume it means something else than what you mean. If you do not write your thesis in English, avoid the use of Anglicisms – words you found in the articles you read that you do not know how to translate. The same holds for words in other languages, though some Germanisms really have no good translation in other languages, like ‘Schadenfreude’. If you leave the original words between single quotation marks (like ‘commitment’ or ‘corporate social responsibility’) and you do not translate them, the reader may suspect you have not translated them because you do not really know what they mean. If you write your thesis in English, the use of single quotation marks often signals a lack of distance to the original text you are summarizing. Also, words between quotation marks suggest that you disagree with using them or that they have negative connotations for you. If so, explain these opinions, or better still: avoid the terms and use more neutral words.
- How far should I go in explaining things?
This is a question I have often heard from students. The answer I usually give to this question is: make sure that an intelligent lay person understands what your question is, what you’re expecting to find, how you designed the research and why you did that the way you did, what your findings are, and what they mean. Do not write for yourself, or for your supervisor. Your thesis may also be evaluated by a second faculty member, perhaps even from outside your institution. If all goes well, your thesis contributes new findings and insights to previous scholarship. Assume your reader is intelligent. Write for your mother, or your uncle Teddy – someone who doesn’t know much about the topic and the research you’re building on. If you really dive into the literature, it will not take much time before you know more about it than your supervisor, let alone your second evaluator.
9.3. Further suggestions
- What was my research question again?
A general rule in writing is ‘Do what you promise’. If you raise a question in the introduction, make sure you answer it – or tell the reader why you will not answer it.
- Should I really be concise?
Yes. Kill your darlings if they obscure things, lead to dead ends or otherwise divert the attention of the reader. You can do this in several phases to ease the pain. First put your beautiful sentences that you cannot say goodbye to in footnotes, and then delete the footnotes. You can save your darlings in a separate document for later use.
- Which terms should I avoid?
Avoid the word ‘process’. This word indicates you are not really sure what is going on.
Avoid double negations like this one: “It is not uncommon for people to be confused by double negations.” Instead, write: “Double negations confuse your audience, so avoid them.”
Avoid clichés. The irritation among readers who read clichés like the one I’m using in this sentence can hardly be overestimated.
Avoid “research has proven that…”. Empirical research cannot provide definitive ‘proof’ of anything. Also the goal of research is not to support certain claims. Instead, the goal is to explore and test.
Avoid abbreviations – just write out the words in full. If you find yourself using a certain combination of words a lot, create an auto-complete shortcut for this combination.
Also keep your use of the words ‘this’, ‘that’, ‘these’ and ‘those’ to a minimum because it is often unclear what these words refer to.
Avoid “in order to”. Simply use “to”, that will do. Also avoid “More often than not”. Instead, simply write “In a majority of cases”, or better still: give the exact percentage if you have it.
Avoid “despite the fact that…” because it leads to long sentences that readers will find difficult to understand.
Don’t say “a number of options”. You will find yourself writing ‘a number of’ when you foresee multiple options, but you don’t know how many you will talk about. Once you’ve written them up, you know how many options you discuss, and replace ‘a number of’ by the actual number.
Finally, avoid the word ‘etc.’ There is literally an endless list of other things you could include in your thesis. After two examples there is always a number of examples you leave out. The same holds for counterarguments, quotes, references, etc.
Use as few quotes as you can. You may put one above your paper or dissertation, but avoid writing in the words of others. Perhaps you are thinking that a quote by one of your intellectual heroes says more than a thousand words of your own. However, if your own writing is a concatenation of quotes from previous research, your reader will start to doubt whether you master your thoughts. Demonstrate your understanding of the matter by writing in your own words.
- How can I avoid plagiarism?
Whenever you use words that someone has written previously, put them between quotation marks. This rule not only applies to the words of others, but also to your own writing. You can quote your own work, as long as it is a quote. As Bekkers (2018, p.6) wrote: “the first task for scientists is to get the facts straight”.
When you use thoughts that someone has expressed previously, give them credit by referring to them. This rule not only applies to your own thoughts, but also to the thoughts of others: “When making use of other people’s ideas, procedures, results and text, do justice to the research involved and cite the source accurately” (KNAW et al., 2018, p.17).
- How can I get spelling advice when the dictionary does not help?
Sometimes the dictionary does not give you much guidance when you are writing. Suppose you are writing about the life course, and you are not sure whether you should write ‘over the life course’, ‘across the life course’, or ‘throughout the life course’. In such cases, do a search for the exact combinations of words. The one that gives you the highest number of hits is probably right. In this case, ‘over’ and ‘across’ give you about the same number of hits, but ‘throughout’ gives you a considerably lower number. So I would say: either use ‘over’ or ‘across’, but not ‘throughout’.
If you make a comparison, say what you compare with what. Complete a sentence about differences between groups, such as “Protestants give more”, by adding the reference category: “than the non-religious”. Complete a sentence about trends by specifying the time period that you compare a score with. For instance: “Protestants give more in the 2010s than they used to do in the 1990s.”
Prize or price? The word ‘price’ with a ‘c’ refers to the amount you pay for a product, e.g. €0.99. ‘Prize’ with a ‘z’ is the money or award you win in a lottery or contest.
Economy or economics? The economy is the thing studied by economists in the academic discipline of economics.
Transparency is correct. Clearly, transparancy is not.
What do you regress on what? ‘To regress’ means ‘to bring back to…’. If you do a regression analysis, mention that you regress a certain outcome Y on an antecedent X or M. You start from the an outcome, and trace back its origins. This means that a regression goes from Y to X.
10. Lay-out
Follow the guidelines in the style guide of your academic program on the format and lay-out of your thesis. Despite their self-evidence, I list the following rules because I have so often seen them violated:
- Always put your name and date on the title page of your paper, and the occasion
- Start each section on a new page. Even if that means you have only one line on a page. Don’t worry about the lay-out before you have finished everything else. Before you know it you spend half an hour shrinking margins to get rid of that single line on the otherwise empty page. Focus, remember?
- Leave space for your supervisor to scribble remarks and suggestions in the margins. Use wide margins and line space (1.5 or 2).
- Put all the publications you have referred to in the main text in a list of references at the end of your document (but before the appendices, if any), also if your thesis is not yet complete. Put all references in one list. Don’t rubricate them into ‘books’ and ‘articles’ and ‘websites’. If you refer to websites, save it to the Internet Archive (https://archive.org/web/) and refer to the URL you get there. Put all references in alphabetical order, not in the order in which you have found them or in the order in which they appear in the main text. Hint: in most word processing software programs you can order references (or any selection of text) in alphabetical order by selecting them all, and clicking ‘Sort’ choosing ‘by paragraph’.
- Insert page numbers on all pages of your paper, except the title page.
- Remove double spaces and trailing blanks using CTRL-H.
- Titles of papers, sections, and paragraphs never end with a period, colon or semi-colon. PERIOD.
- Avoid the use of variable names straight from your data set such as
ehgincy, pid
or v660_3b.
- Use a serious font, not Comic Sans MS.
- In the layout of tables and figures, less is more. Avoid colored or shaded rows and columns and remove gridlines and outside borders. Beware of over precision: do not put more than two decimals in your tables, unless the standard errors of your estimates justify more decimals. Left align text in your tables, and right align numbers. Table 4 provides an example.
11. Working with an outline
11.1. Structuring your thoughts
Do you have trouble organizing your text, or getting your thoughts on paper? Have you had the experience that you did not know the best way to formulate a sentence and ended up not writing down anything at all? A great strategy that you can try to solve this problem is to work with an outline. This method helps many people who got stuck after an enthusiastic start of their research project. It may not work for you, but the only way to figure out whether it works for you is to try it first.
- How can I write a text from an outline?
Start with a list of the sections that your thesis or paper consists of. The typical structure of a thesis is the following:
Preface
- Introduction
- Theory
- Data and Methods
- Results
- Conclusion and Discussion
In the second step, develop your sections into paragraphs. Here’s an example for the first section:
- Introduction
- Research question
- Societal relevance
- Scientific relevance
- Context
In the third step, copy the outline of the second step and formulate section headings as questions.
1. Introduction
a. Research question
Which questions will I answer in this thesis?
b. Societal relevance
Why would it be important for people in society to know the answer to the questions I am asking?
c. Scientific relevance
What does my research add to the existing literature? How is it innovative?
d. Context
Which developments in society make my research relevant?
In the fourth step, copy the outline of the third step and elaborate. Use the questions to focus your writing. If you are writing sentences that do not really contribute much to an answer to the question, you are getting side tracked. Stop writing in this direction and focus again on your question.
11.2. Reconstructing the thoughts of others
If you would like to have an example for an outline, you can reverse engineer one. This is the idea of the reverse outline. Take a journal article that you think is very clear and that others also recommend as a good example. For instance: if you know in which journal you would like to publish your paper, go to the website of the journal, and find the most cited paper of that journal. Go through the article section by section, and ask yourself: what is the purpose of this section? How do the authors reach that goal in this particular section? Describe the purpose of each section in one sentence. Take another sentence to describe how the authors achieve that purpose. To illustrate how this works, I will give you the outline for the section you are currently reading.
11.2. Reverse outline
Explain the reverse outline method.
The reverse outline method is the reverse of the outline method: it starts with a text and reconstructs its goals and instruments to achieve them.
12. Publishing your research
When your research report is done, make an effort to reach the audience that you addressed in the introduction. Make your research available to this audience. Upload a pdf of your report to a publicly available archive, such as SocArxiv or PsyArxiv. These are excellent platforms to share your research because they are free to use and openly accessible by anyone. Also they are not owned by commercial corporations, but by a nonprofit organization. They do not require readers to register themselves on the platform or pay a fee to read your work.
Regardless of the type of research you have done or the publication format you strive for, it is a good idea to create a project on the Open Science Framework for your research. I’ve created a template at https://osf.io/3g7e5/ that you can duplicate. You can post all materials, the data, the code or analysis script, and the research report on the page. The research report is sometimes referred to as a ‘preprint’ – the text before it is reviewed.
Sharing the research report with the public is good for you because your work will reach a wider audience. Put your name and date on the front page so that others can cite your work. Assign a DOI, which makes your work traceable and citable. You can assign a separate DOI to each table and figure, which makes them traceable and citable independent of the research paper. Give your text a license that fits your purposes. This text, for instance, has a CC – BY – NC – ND license, which allows everybody to download it and share it with others, as long as I am credited as the author, and the work is not changed, and not distributed commercially.
Share the data you collected so that others can use it too, for instance on Dataverse https://dataverse.org/ or the Open Science Framework, https://osf.io/. Assign a DOI to your data so that others can cite it and give you credit for the work you did. But be careful when sharing data. Before you send a data set to others and before you share it online through a platform like OSF, make sure you are allowed to do so. Also make sure you remove all personal information about the participants and the interviewers from the file. Note that an IP address is also personal information. Further guidelines on how to document data and code are here.
If you wrote a thesis at a university, your library may have an automatic archiving system that makes your work available. Usually it takes until after your graduation before your thesis is published. So if you would like to get feedback before that time, consider posting your work to an open archive.
If you wrote an empirical research paper, you may want to submit it to a journal for peer review and publication. Invite your supervisor to help you with this. You should know that getting your work published may take a long time. Depending on the discipline, the toughness of the review process and the frequency with which the journal publishes papers, getting from submission to an eventual publication in print will take at least three months. In the more typical scenario, it will take at least one and sometimes two or even three rounds of revisions and that will take about a year’s time. That is, if you even get a chance to revise your paper. In the worst case, you get a ‘desk-reject’: a message from the editors that they do not send out your paper for review. If your paper is sent out for review, and the reviewers have mercy, you will get a Revise and Resubmit (‘R&R’): a lengthy letter with lots of detailed comments, suggestions and requests for changes in your manuscript.
- “How should I respond to strong criticism?”
First of all, don’t panic. Do not let yourself be discouraged by the criticism of the reviewers. Even experienced researchers like myself rarely get through the review process easily. Fierce evaluations are the rule rather than the exception. So if you get tough questions, see them as an opportunity to improve your paper. You may be able to get your research published if you manage to address the issues raised by the reviewers.
Second, take the suggestions seriously, and think carefully about each suggestion. Talk to your co-authors about the substantive and methodological issues that the reviewers suggest should be improved. You should not blindly follow each and every suggestion that a reviewer gives. Sometimes the suggestions of reviewers are just too much work, impossible to carry out, or even incorrect. In the best case, the editor has carefully read the reviews, and will give you some guidance about which suggestions to follow and which to ignore. More commonly, however, the editor does not voice her own opinion about the suggestions of reviewers, and lets you sort out the sense from the nonsense yourself. In any case, explain clearly what you have changed in the revised version of your manuscript.
Write a polite letter to the editor explaining what you did in response to each of the issues raised by the reviewers. Repeat each issue raised in the letter, and describe what you have done to address the issue, referring to the exact location in your revised manuscript. This is helpful to reviewers and editors because they have less trouble checking your revision.
13. Presenting your research
How to prepare
Practice. Multiple times.
Make sure you know how the equipment works.
Keep it short. Stay within the time limit.
Reserve time for questions.
Think about what you want from the audience.
Your presentation
On your slides, use a large font size, preferably more than 24 pt.
DO NOT USE ALL CAPS ALL THE TIME – IT BLURS THE ATTENTION OF YOUR AUDIENCE.
On each slide, present only a few bits of information, preferably less than 5 ‘bullets’.
Use the same font and the same design of slides throughout your presentation.
Use images and graphics.
…..in such a way that they do not divert the attention of the audience to your message.
Don’t let the text of your slides “fly in”. You can let them appear.
Make sure your presentation file is compatible with the equipment in the room. If you don’t know what kind of equipment is available, also save your presentation as a pdf file.
In the room
Put your presentation on the system and check if it’s working properly.
In Acrobat Reader, press CTRL-L to display your file on a LARGE screen. In PowerPoint, press F5 or Shift-F5 to start.
Creating your presentation
Put your main result in the title.
Start with your research question.
Wake up the audience with an anecdote, a cartoon or something funny.
Do not present the structure of your presentation on a separate slide. The audience will find out what the structure is along the way.
If you have an empirical paper:
- Focus on the results.
- Spend less time on the hypotheses.
- Don’t show tables of results. Select the most relevant coefficients and present those in a graph. Add a note disclosing the data source and model estimated, including a list of variables that you included as covariates in the analysis (if any).
Put questions or findings as titles above your slides, not topics.
Use metaphors that spark the imagination.
You can suggest questions for discussion to the audience. What do you want to know from or discuss with the audience?
Put additional results, examples, and references on extra slides that you can show in response to questions from the audience.
How to present
Vary the tone of your voice.
Stand up. Don’t sit down.
Present. Don’t read your paper.
Look at people in the audience.
Avoid looking at one and the same person all of the time. Look around.
Be friendly. You’re not at war.
Watch this TED talk by Will Stephen for suggestions on how to convince your audience: http://boingboing.net/2016/03/14/will-stephen-gives-a-ted-talk.html
If you present your research on a poster, follow advice by Colin Purrington: https://colinpurrington.com/tips/poster-design/
References
Babiak, K., & Thibault, L. (2009). Challenges in multiple cross-sector partnerships. Nonprofit and Voluntary Sector Quarterly, 38(1), 117-143. https://doi.org/10.1177%2F0899764008316054
Bekkers, R. (2010). An Introduction to the Study of Philanthropy. https://renebekkers.files.wordpress.com/2018/01/anintroduction_v5.pdf
Bekkers, R. (2013). De maatschappelijke betekenis van filantropie [The societal significance of philanthropy]. Inaugural lecture, Vrije Universiteit Amsterdam. https://renebekkers.files.wordpress.com/2013/04/bekkers_filantropie.pdf
Bekkers, R. (2016). Tools for the Evaluation of the Quality of Experimental Research. November 11, 2016. https://renebekkers.wordpress.com/2016/11/11/tools-for-the-evaluation-of-the-quality-of-experimental-research/
Bekkers, R. (2018). Values of Philanthropy. Keynote Address, ISTR Conference 2018, July 12, 2018, Amsterdam. https://renebekkers.files.wordpress.com/2018/07/values-of-philanthropy.pdf
Bekkers, R., De Wit, A. & Wiepking, P. (2017). Jubileumspecial: Twintig jaar Geven in Nederland. Pp. 61-94 in: Bekkers, R. Schuyt, T.N.M., & Gouwenberg, B.M. (Eds.). Geven in Nederland 2017: Giften, Sponsoring, Legaten en Vrijwilligerswerk. Amsterdam: Lenthe. https://renebekkers.files.wordpress.com/2018/06/bekkers_dewit_wiepking_17.pdf
Bekkers, R. & Schuyt, T.N.M. (2008). And Who is Your Neighbor? Explaining the Effect of Religion on Charitable Giving and Volunteering. Review of Religious Research, 50 (1): 74-96. https://renebekkers.files.wordpress.com/2011/08/bekkers_schuyt_rrr_08.pdf
Bekkers, R. & Verkaik, D. (2015). How to estimate what participation in third sector activities does for participants. Deliverable 3.2 of the project: “Impact of the Third Sector as Social Innovation” (ITSSOIN, 613177), European Commission – 7th Framework Programme, Brussels: European Commission, DG Research. http://itssoin.eu/site/wp-content/uploads/2014/03/ITSSOIN_D3_2_What-participation-does-for-participants.pdf
Bekkers, R., & Wiepking, P. (2011). Who gives? A literature review of predictors of charitable giving part one: Religion, education, age and socialisation. Voluntary Sector Review, 2(3), 337-365.
Brembs, B. (2018). Prestigious Science Journals Struggle to Reach Even Average Reliability. Frontiers in Human Neuroscience, https://doi.org/10.3389/fnhum.2018.00037
Brown, S. J., Goetzmann, W., Ibbotson, R. G., & Ross, S. A. (1992). Survivorship bias in performance studies. The Review of Financial Studies, 5(4), 553-580. https://doi.org/10.1093/rfs/5.4.553
Bryan, M.L. & Jenkins, S.P. (2016). Multilevel Modelling of Country Effects: A Cautionary Tale. European Sociological Review, 32 (1): 3–22. https://doi.org/10.1093/esr/jcv059
Campbell, D.E., & Yonish, S.J. (2003). Religion and Volunteering in America. Pp. 87-106 in C. Smidt (ed.) Religion as Social Capital. Waco, Texas: Baylor University Press.
Carlin, P. S. (2001). Evidence on the volunteer labor supply of married women. Southern Economic Journal, 67(4): 801-824.
Clarke, A., & Crane, A. (2018). Cross-sector partnerships for systemic change: Systematized literature review and agenda for further research. Journal of Business Ethics, 150(2), 303-313. https://doi.org/10.1007/s10551-018-3922-2
Clemens, M.A. (2017). The Meaning of Failed Replications: A Review and Proposal. Journal of Economic Surveys, 31(1): 326-345.
Cochrane, J.H. (2005). Writing Tips for Ph. D. Students. http://faculty.chicagobooth.edu/john.cochrane/teaching/papers/phd_paper_writing.pdf
Connelly, B.S. & Chang, L. (2016). A Meta-Analytic Multitrait Multirater Separation of Substance and Style in Social Desirability Scales. Journal of Personality, 84: 319-334. https://doi.org/10.1111/jopy.1216
Cortina, J.M. (1993). What is Coefficient Alpha? An Examination of Theory and Applications. Journal of Applied Psychology, 78: 98-104. http://dx.doi.org/10.1037/0021-9010.78.1.98
Crowne, D. P., & Marlowe, D. (1960). A new scale of social desirability independent of psychopathology. Journal of Consulting Psychology, 24: 349–354. http://dx.doi.org/10.1037/h0047358
De Vaus, D. (2001). Research Design in Social Research. London: Sage.
DeVaux, R.D., Velleman, P.F., & Bock, D.E. (2012). Stats: Data and Models. Third Edition. Boston: Pearson Education.
De Wit, A., Qu, E.H. & Bekkers, R. (2021). The health advantage of volunteers in Europe is larger for the elderly and the less healthy. https://osf.io/zqjnb/
Dillard, S. [JudgeDillard]. (2018, February 20). Before your final review, temporarily change the font on your brief (or opinion). You'll catch more typos and errors that way. Retrieved from https://twitter.com/JudgeDillard/status/966116574112468992
Eco, U. (2015[1977]). How to Write a Thesis. Cambridge: MIT Press.
Eidlin, F. (2011). The methods of problem versus the methods of topic. PS: Political Science & Politics, 44: 758-761. https://doi.org/10.1017/S1049096511001260
Elwert, F., & Winship, C. (2014). Endogenous selection bias: The problem of conditioning on a collider variable. Annual Review of Sociology, 40, 31-53. https://doi.org/10.1146/annurev-soc-071913-043455
Fanelli, D. (2012). Negative results are disappearing from most disciplines and countries. Scientometrics, 90: 891-904. https://doi.org/10.1007/s11192‐011‐0494‐7
Fang, F.C., Steen, R.G. & Casadevall, A. (2012). Misconduct accounts for the majority of retracted scientific publications. PNAS, 109: 17028-17033. https://doi.org/10.1073/pnas.1212247109
Firebaugh, G. (2008). Seven Rules for Social Research. Princeton: Princeton University Press.
Fisher, R. J. (1993). Social desirability bias and the validity of indirect questioning. Journal of Consumer Research, 20(2), 303-315. https://doi.org/10.1086/20935
Gerring, J. & McDermott, R. (2007). An Experimental Template for Case Study Research. American Journal of Political Science, 51: 688–701. https://doi.org/10.1111/j.1540-5907.2007.00275.x
Goodman, S. (2008). A Dirty Dozen: Twelve P-Value Misconceptions. Seminars in Hematology, 45: 135-140. https://doi.org/10.1053/j.seminhematol.2008.04.003
Gordon, B.R., Zettelmeyer, F., Bhargava, N. & Chapsky, D. (2017). A Comparison of Approaches to Advertising Measurement: Evidence from Big Field Experiments at Facebook. https://ssrn.com/abstract=3033144
Henrich, J., Heine, S.J., & Norenzayan, A. (2010). The weirdest people in the world? Behavioral and Brain Sciences, 33: 61-135.
Helmig, B., Spraul, K. & Tremp, K. (2012). Replication Studies in Nonprofit Research: A Generalization and Extension of Findings Regarding the Media Publicity of Nonprofit Organizations. Nonprofit and Voluntary Sector Quarterly, 41(3): 360–385.
Hofstadter, D.R. (1999). Gödel, Escher, Bach. Anniversary Edition: An Eternal Golden Braid. New York: Basic Books.
James III, R.N., & Jones, K.S. (2011). Tithing and religious charitable giving in America. Applied Economics, 43(19): 2441-2450.
Joinson, A. (1999). Social desirability, anonymity, and Internet-based questionnaires. Behavior Research Methods, Instruments, & Computers, 31(3), 433-438. https://doi.org/10.3758/BF03200723
Kelly, E. L., & Conley, J. J. (1987). Personality and compatibility: A prospective analysis of marital stability and marital satisfaction. Journal of Personality and Social Psychology, 52(1), 27.
https://doi.org/10.1037//0022-3514.52.1.27
Kerr, N.L. (1989). HARKing: Hypothesizing After Results are Known. Personality and Social Psychology Review, 2: 196-217. https://doi.org/10.1207%2Fs15327957pspr0203_4
King, G. [kinggary]. (2018, February 8). If you're picking a topic to write a paper about, ask yourself just one question: _whose mind are you going to change about what?_ Retrieved from https://twitter.com/kinggary/status/961636186761695234
KNAW, NFU, NWO, TO Federatie, Netherlands Association of Universities for Applied Sciences, & VSNU (2018). Netherlands Code of Conduct for Research Integrity 2018. https://www.vsnu.nl/files/documents/Netherlands%20Code%20of%20Conduct%20for%20Research%20Integrity%202018.pdf
Koschmann, M. A., Kuhn, T. R., & Pfarrer, M. D. (2012). A communicative framework of value in cross-sector partnerships. Academy of Management Review, 37(3), 332-354. https://doi.org/10.5465/amr.2010.0314
Krumpal, I. (2013). Determinants of social desirability bias in sensitive surveys: a literature review. Quality & Quantity, 47(4), 2025-2047. https://doi.org/10.1007/s11135-011-9640-9
Lakens, D. (2021). Sample Size Justification. https://psyarxiv.com/9d3yf/
Lelkes, Y., Krosnick, J. A., Marx, D. M., Judd, C. M., & Park, B. (2012). Complete anonymity compromises the accuracy of self-reports. Journal of Experimental Social Psychology, 48(6), 1291-1299. https://doi.org/10.1016/j.jesp.2012.07.002
Locke, S. (2018). The Datasaurus data package.
https://cran.r-project.org/web/packages/datasauRus/vignettes/Datasaurus.html
Maas, C.J.M. & Hox, J.J. (2005). Sufficient Sample Sizes for Multilevel Modeling. Methodology, 1: 86-92. https://doi.org/10.1027/1614-2241.1.3.86.
Martín-Martín, A., Orduna-Malea, E., Thelwall, M., & López-Cózar, E.D. (2018). Google Scholar, Web of Science, and Scopus: a systematic comparison of citations in 252 subject categories. Journal of Infometrics, 12 (4): 1160-1177. https://doi.org/10.1016/J.JOI.2018.09.002
McCrae, R.R., & Costa, P.T. (1983). Social desirability scales: More substance than style. Journal of Consulting and Clinical Psychology, 51: 882–888.
Meehl, P.E., & Hathaway, S.R. (1946). The K factor as a suppressor variable in the Minnesota Multiphasic Personality Inventory. Journal of Applied Psychology, 30: 525–564.
Menchik, P. L., & Weisbrod, B. A. (1987). Volunteer labor supply. Journal of Public Economics, 32(2), 159-183.
Neugeboren, R., & Jacobson, M. (2005). Writing Economics: A Guide for Harvard’s Sophomore Economics Concentrators. http://sites.fas.harvard.edu/~ec970bk/Writing_Economics/WritingEconomics.pdf
Nosek, B.A., et al., (2015). Promoting An Open Research Culture. Science, 348: 1422-1425. http://science.sciencemag.org/content/348/6242/1422
Occamsbeard (2014). Bullshit Bingo. http://occamsbeard.com/bullshit-bingo/
Open Science Collaboration (2015). Estimating the Reproducibility of Psychological Science. Science, 349. http://www.sciencemag.org/content/349/6251/aac4716.full.html
Park, J.Z., & Smith, C. (2000). “To Whom Much Has Been Given”: Religious Capital and Community Voluntarism Among Churchgoing Protestants. Journal for the Scientific Study of Religion, 39: 272-286. https://doi.org/10.1111/0021-8294.00023
Parry, H.J. & Crossley, H.M. (1950). Validity of response to survey questions. Public Opinion Quarterly, 14: 61–80. https://doi.org/10.1086/266150
Perugini, M., Gallucci, M., & Costantini, G. (2018). A practical primer to power analysis for simple experimental designs. International Review of Social Psychology, 31(1): 20, 1-23. http://doi.org/10.5334/irsp.181
Pierson, D.J. (2004). How to Write an Abstract That Will Be Accepted for Presentation. Respiratory Care, 49:1206-1212. http://www.rcjournal.com/contents/10.04/10.04.1206.pdf
Ratcliffe, S. (2012). Taking the Credit. http://blog.oxforddictionaries.com/2012/10/taking-the-credit/
Robins, R. W., Caspi, A., & Moffitt, T. E. (2000). Two personalities, one relationship: Both partners' personality traits shape the quality of their relationship. Journal of Personality and Social Psychology, 79(2), 251. https://doi.org/10.1037/0022-3514.79.2.251
Rossi, P.H. (1987). The Iron Law of Evaluation and Other Metallic Rules. Research in Social Problems and Social Policy, 4: 3-28. https://www.gwern.net/docs/sociology/1987-rossi.pdf
Schönbrodt, F.D. & Perugini, M. (2013). At what sample size do correlations stabilize? Journal of Research in Personality, 47(5): 609-612. https://doi.org/10.1016/j.jrp.2013.05.009.
Seawright, J. & Gerring, J. (2008). Case Selection Techniques in Case Study Research : A Menu of Qualitative and Quantitative Options. Political Research Quarterly, 61: 294-308. https://doi.org/10.1177/1065912907313077
Selsky, J. W., & Parker, B. (2005). Cross-sector partnerships to address social issues: Challenges to theory and practice. Journal of Management, 31(6), 849-873. https://doi.org/10.1177%2F0149206305279601
Shadish, W.R., Cook, T.D. & Campbell, D.T. (2002). Experimental and Quasi-Experimental Designs for Generalized Causal Inference. Boston/New York: Houghton Mifflin.
Simmons, J.P., Nelson, L.D., & Simonsohn, U. (2011). False positive psychology: Undisclosed flexibility in data collection and analysis allows presenting anything as significant. Psychological Science, 22: 1359–1366. https://doi.org/10.1177/0956797611417632
Simons, D.J., Shoda, Y., & Lindsay, S.D. (2017). Constraints on Generality (COG): A Proposed Addition to All Empirical Papers. Perspectives on Psychological Science, https://doi.org/10.1177/1745691617708630
Simonsohn, U., Nelson, L.D. & Simmons, J.P. (2014). P-Curve: A Key To The File Drawer. Journal of Experimental Psychology: General, 143: 534-547. http://dx.doi.org/10.1037/a0033242
Sociomama (February 8, 2018). Sociomama’s Checklist for Good Academic Writing (at least in Sociology).
https://sociomama.wordpress.com/2018/02/08/sociomamas-checklist-for-good-academic-writing-at-least-in-sociology/
Thomson, P. (2017). Avoiding the laundry list literature review. September 11, 2017. https://patthomson.net/2017/09/11/avoiding-the-laundry-list-literature-review/
Ultee, W., Arts, W. & Flap, H. (2009). Sociologie: Vragen, Uitspraken, Bevindingen. Groningen: Noordhoff.
Watson, D., Hubbard, B., & Wiese, D. (2000). General traits of personality and affectivity as predictors of satisfaction in intimate relationships: Evidence from self‐and partner‐ratings. Journal of Personality, 68(3), 413-449. https://doi.org/10.1111/1467-6494.00102
Wiepking, P., & Bekkers, R. (2012). Who gives? A literature review of predictors of charitable giving. Part Two: Gender, family composition and income. Voluntary Sector Review, 3(2), 217-245.
Wilson, J. (2000). Volunteering. Annual Review of Sociology, 26: 215-240.
Wuthnow, R. (1998). Loose Connections: Joining Together in America’s Fragmented Communities. Cambridge: Harvard University Press.
Ziliak, S.T., & McCloskey, D. (2004). Size matters: the standard errors of regressions in the American Economic Review. Journal of Socio-Economics, 33: 527-546. https://doi.org/10.1016/j.socec.2004.09.024
Some inspiring quotes
Taken from Georges Monette’s website (http://www.math.yorku.ca/~georges/):
“Far better an approximate answer to the right question, which is often vague, than an exact answer to the wrong question, which can always be made precise.” – John W. Tukey, (1962), ”The future of data analysis.” Annals of Mathematical Statistics 33, 1-67.
“A bad answer to a good question may be far better than a good answer to a bad question.” – a graduate class extrapolating from Tukey's dictum.
“It is better to know some of the questions than all of the answers.” – James Thurber
“All models are wrong but some are useful.” – George E. P. Box; Empirical Model-Building and Response Surfaces, 1987
“All models are wrong but, we hope, not as wrong as the ones we used earlier.” –paraphrased from Isaac Asimov
“It is much more important to be clear than to be correct.” – Blair Wheaton
“It is better to be wrong than to be vague.” – Freeman Dyson
“Science may be described as the art of systematic over-simplification.” – Karl Popper
“There are three kinds of lies: lies, damned lies, and statistics.” – Mark Twain with attribution to Benjamin Disraeli
“It is easy to lie with statistics. It is hard to tell the truth without it.” – Andrejs Dunkels
“If you try to estimate everything, you will end up estimating nothing.” – [I forget who said this but I'd like to know!]
“Causal interpretation of the results of regression analysis of observational data is a risky business. The responsibility rests entirely on the shoulders of the researcher, because the shoulders of the statistical technique cannot carry such strong inferences.” – Jan de Leeuw.
“Not everything that can be counted counts, and not everything that counts can be counted.” – Albert Einstein
“If a man is offered a fact which goes against his instincts, he will scrutinize it closely, and unless the evidence is overwhelming, he will refuse to believe it. If, on the other hand, he is offered something which affords a reason for acting in accordance to his instincts, he will accept it even on the slightest evidence.” – Bertrand Russell
“The absence of evidence is not the evidence of absence” – Carl Sagan and many many others
“Believe those who are seeking the truth. Doubt those who find it.” – André Gide
“If you amplify everything, you hear nothing.” – Jon Stewart
“Seek the company of those who seek the truth, and run away from those who have found it.” – Vaclav Havel
“The scientist is not a person who gives the right answers, he is one who asks the right questions.” – Claude Lévi-Strauss ( Le Cru et le Cuit, 1964 ) (*)
“Correlation does not imply causation but it does waggle its eyebrows suggestively and gesture furtively while mouthing 'look over there.' – Randall Munroe, xkcd.com.
'If you torture the data long enough it will confess' - Ronald Coase
Lisa Simpson on Happiness vs Intelligence
W. Edwards Deming: “Without data, you’re just another person with an opinion” – “In God we trust, all others must bring data”
Research Quality Checklist for Experiments
Preregistration
1. Was the study preregistered prior to the data analysis?
If yes:
2. The preregistration is posted at: [URL]
3. When was the preregistration posted? Before data were collected, before data were explored, before data were analyzed
The preregistration describes:
4. Inclusion and exclusion criteria for participation
5. All procedures for assigning participants to conditions
6. All procedures for randomizing stimulus materials
7. Any procedures for ensuring that participants, experimenters, and data-analysts were kept naive (blinded) to potentially biasing information
8. A rationale for the sample size used (e.g., an a priori power analysis)
9. All measures completed by the participants (including those not used in the study)
10. The data preprocessing scripts (cleaning, transformations, normalization, smoothing)
11. A plan for handling missing data (e.g., unit non-response, attrition between rounds, dropout from survey)
12. The intended statistical analysis for each research question (including information about the sidedness of the tests, inference criteria, corrections for multiple testing, model selection criteria, prior distributions and other plans)
Sampling
13. Does the paper provide a rationale for the sample size used, preferably an a priori power analysis?
14. Does the paper report how participants were recruited for the experiment?
15. Does the paper report eligibility criteria for participation in the experiment? E.g., with respect to nationality, gender, age, experience, prior knowledge on the subject matter?
Procedure
16. Does the paper report where and when the experiment was conducted?
17. For a lab experiment: does the paper report how participants were welcomed, by whom, how and where they were seated, how they completed the experiment, and how they were debriefed? Were experimenters blind to the hypotheses?
18. Were participants fully informed? If not, was deception necessary? Were participants asked which hypotheses they suspected were being tested?
19. Does the paper report how participants were paid, and which conditions determined the size of the payment?
Materials
20. Does the paper provide details about IRB approval (e.g., location, registration number)?
21. Does the paper describe or provide a link to all instructions and stimuli for participants?
22. Does the paper describe or provide a link to all measures completed by the participants (including those not used in the study)?
23. Does the paper provide a link to the processed data?
24. Does the paper provide a link to the code/script used to preprocess the data?
25. Does the paper provide a link to the code/script used to obtain the results reported?
27. Does the paper mention which software (including version) was used?
Randomization
28. Does the paper report how participants were randomized into conditions and how stimulus materials were randomized?
29. Are numbers of observations per condition approximately equal to the design for randomization?
30. Does the paper report checks on deviations from randomization (e.g., comparison of covariates per condition)?
Manipulation and attention check
31. Does the manipulation fit the theoretical mechanism?
32. Is the manipulation clean? What other consequences did the manipulation have, in addition to the theoretically relevant effect?
33. Does the paper report a manipulation check? Is it clear whether participants who failed the manipulation check included or excluded? Are results reported for both choices?
34. Particularly for online experiments: were attention checks included?
35. Are the materials and measures validated (e.g. in previous research or a pilot study)?
Dependent variable
36. To what extent is the dependent variable a valid measure of the construct in the theory and hypotheses?
37. For experiments on charitable giving: did participants make an actual donation decision, multiple decisions of which only one was executed, or did they state donation intentions? Were donation decisions by participants actually executed? If they were not executed, did participants believe they would be?
38. Does the paper report analyses of multiple dependent variables? If so, how are the dependent variables interrelated? If the paper reports analyses of multiple dependent variables in different studies, why? Were these changes planned, and do they follow from the arguments in the hypotheses?
Analyses
39. Does the paper present a table of descriptive statistics?
40. Does the paper distinguish explicitly between "hypothesis testing" (i.e., ‘confirmatory’, prespecified) and "exploratory" (i.e., not prespecified) analyses?
41. Does the paper report how missing data and participant dropout was handled (e.g., replaced, omitted).
42. If covariates are included: does the paper report results without covariates? If only an analysis including covariates is reported, ask for an additional analysis without covariates.
43. If outliers were removed: does the paper report results without outliers? If only an analysis excluding outliers is reported, ask for an additional analysis including outliers.
44. If the analysis includes scales: does the paper report the reliability or a factor analysis of each scale? Is the reliability sufficiently high?
45. In an analysis with moderator variables: is the main effect included? Are ordinal/linear variables in the interaction term centered?
46. Does the paper report adequate statistical tests, given the measurement scales of the variables (nominal, ordinal, linear) and their distribution (normal, non-normal)?
47. Does the paper use appropriate statistical models, given the structure of the data (nesting, repeated measures) and are the statistical analyses reported correctly? Are the test-statistics accurate? Are sample sizes reported for each cell of the design?
48. Does the paper report robustness checks?
Interpretation
49. Does the paper interpret the effect sizes in a substantive manner?
50. Does the paper discuss alternative explanations of the results?
51. Does the paper discuss limitations to the research?