

 vetskilling.
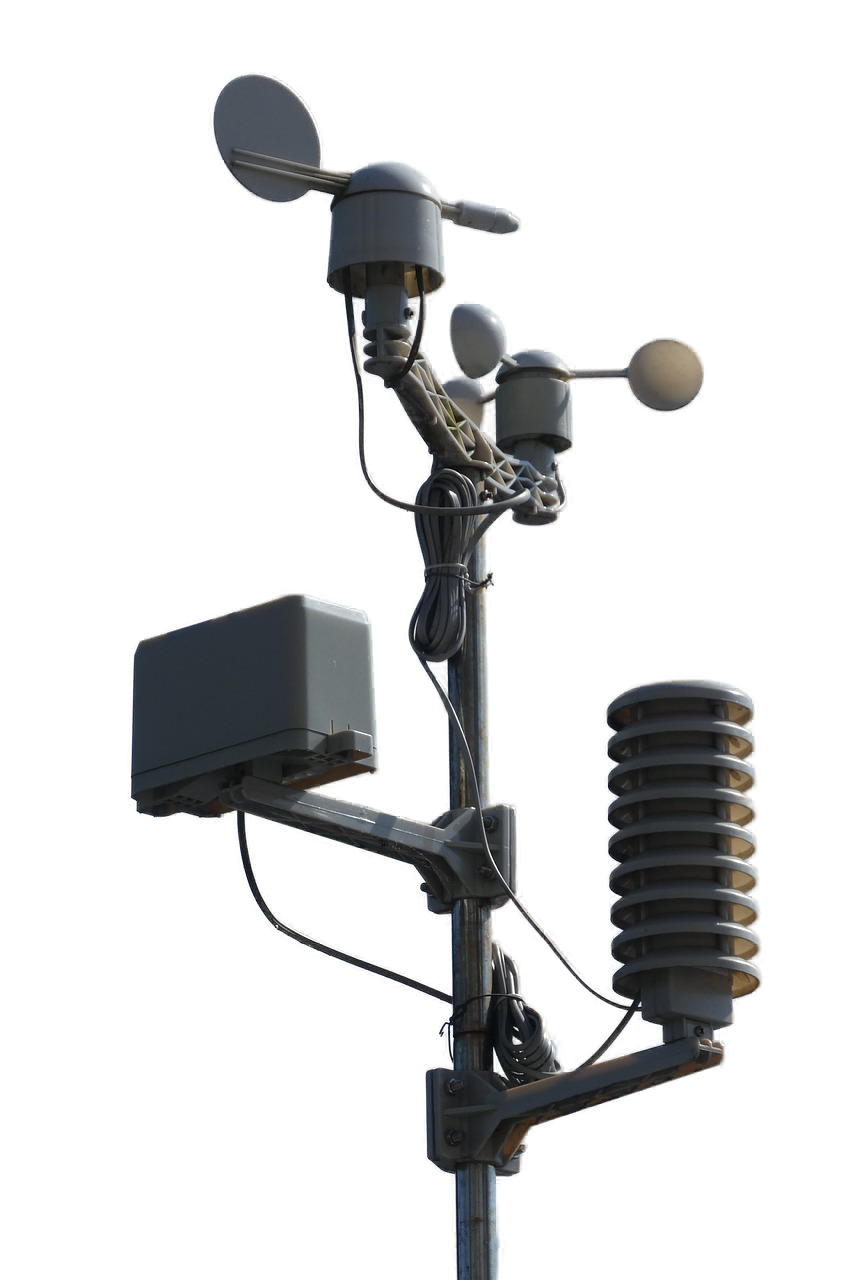

 =
= 


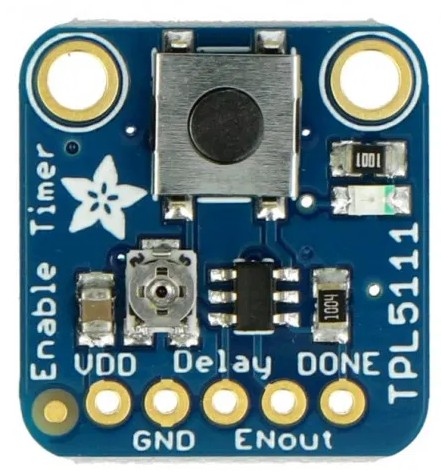
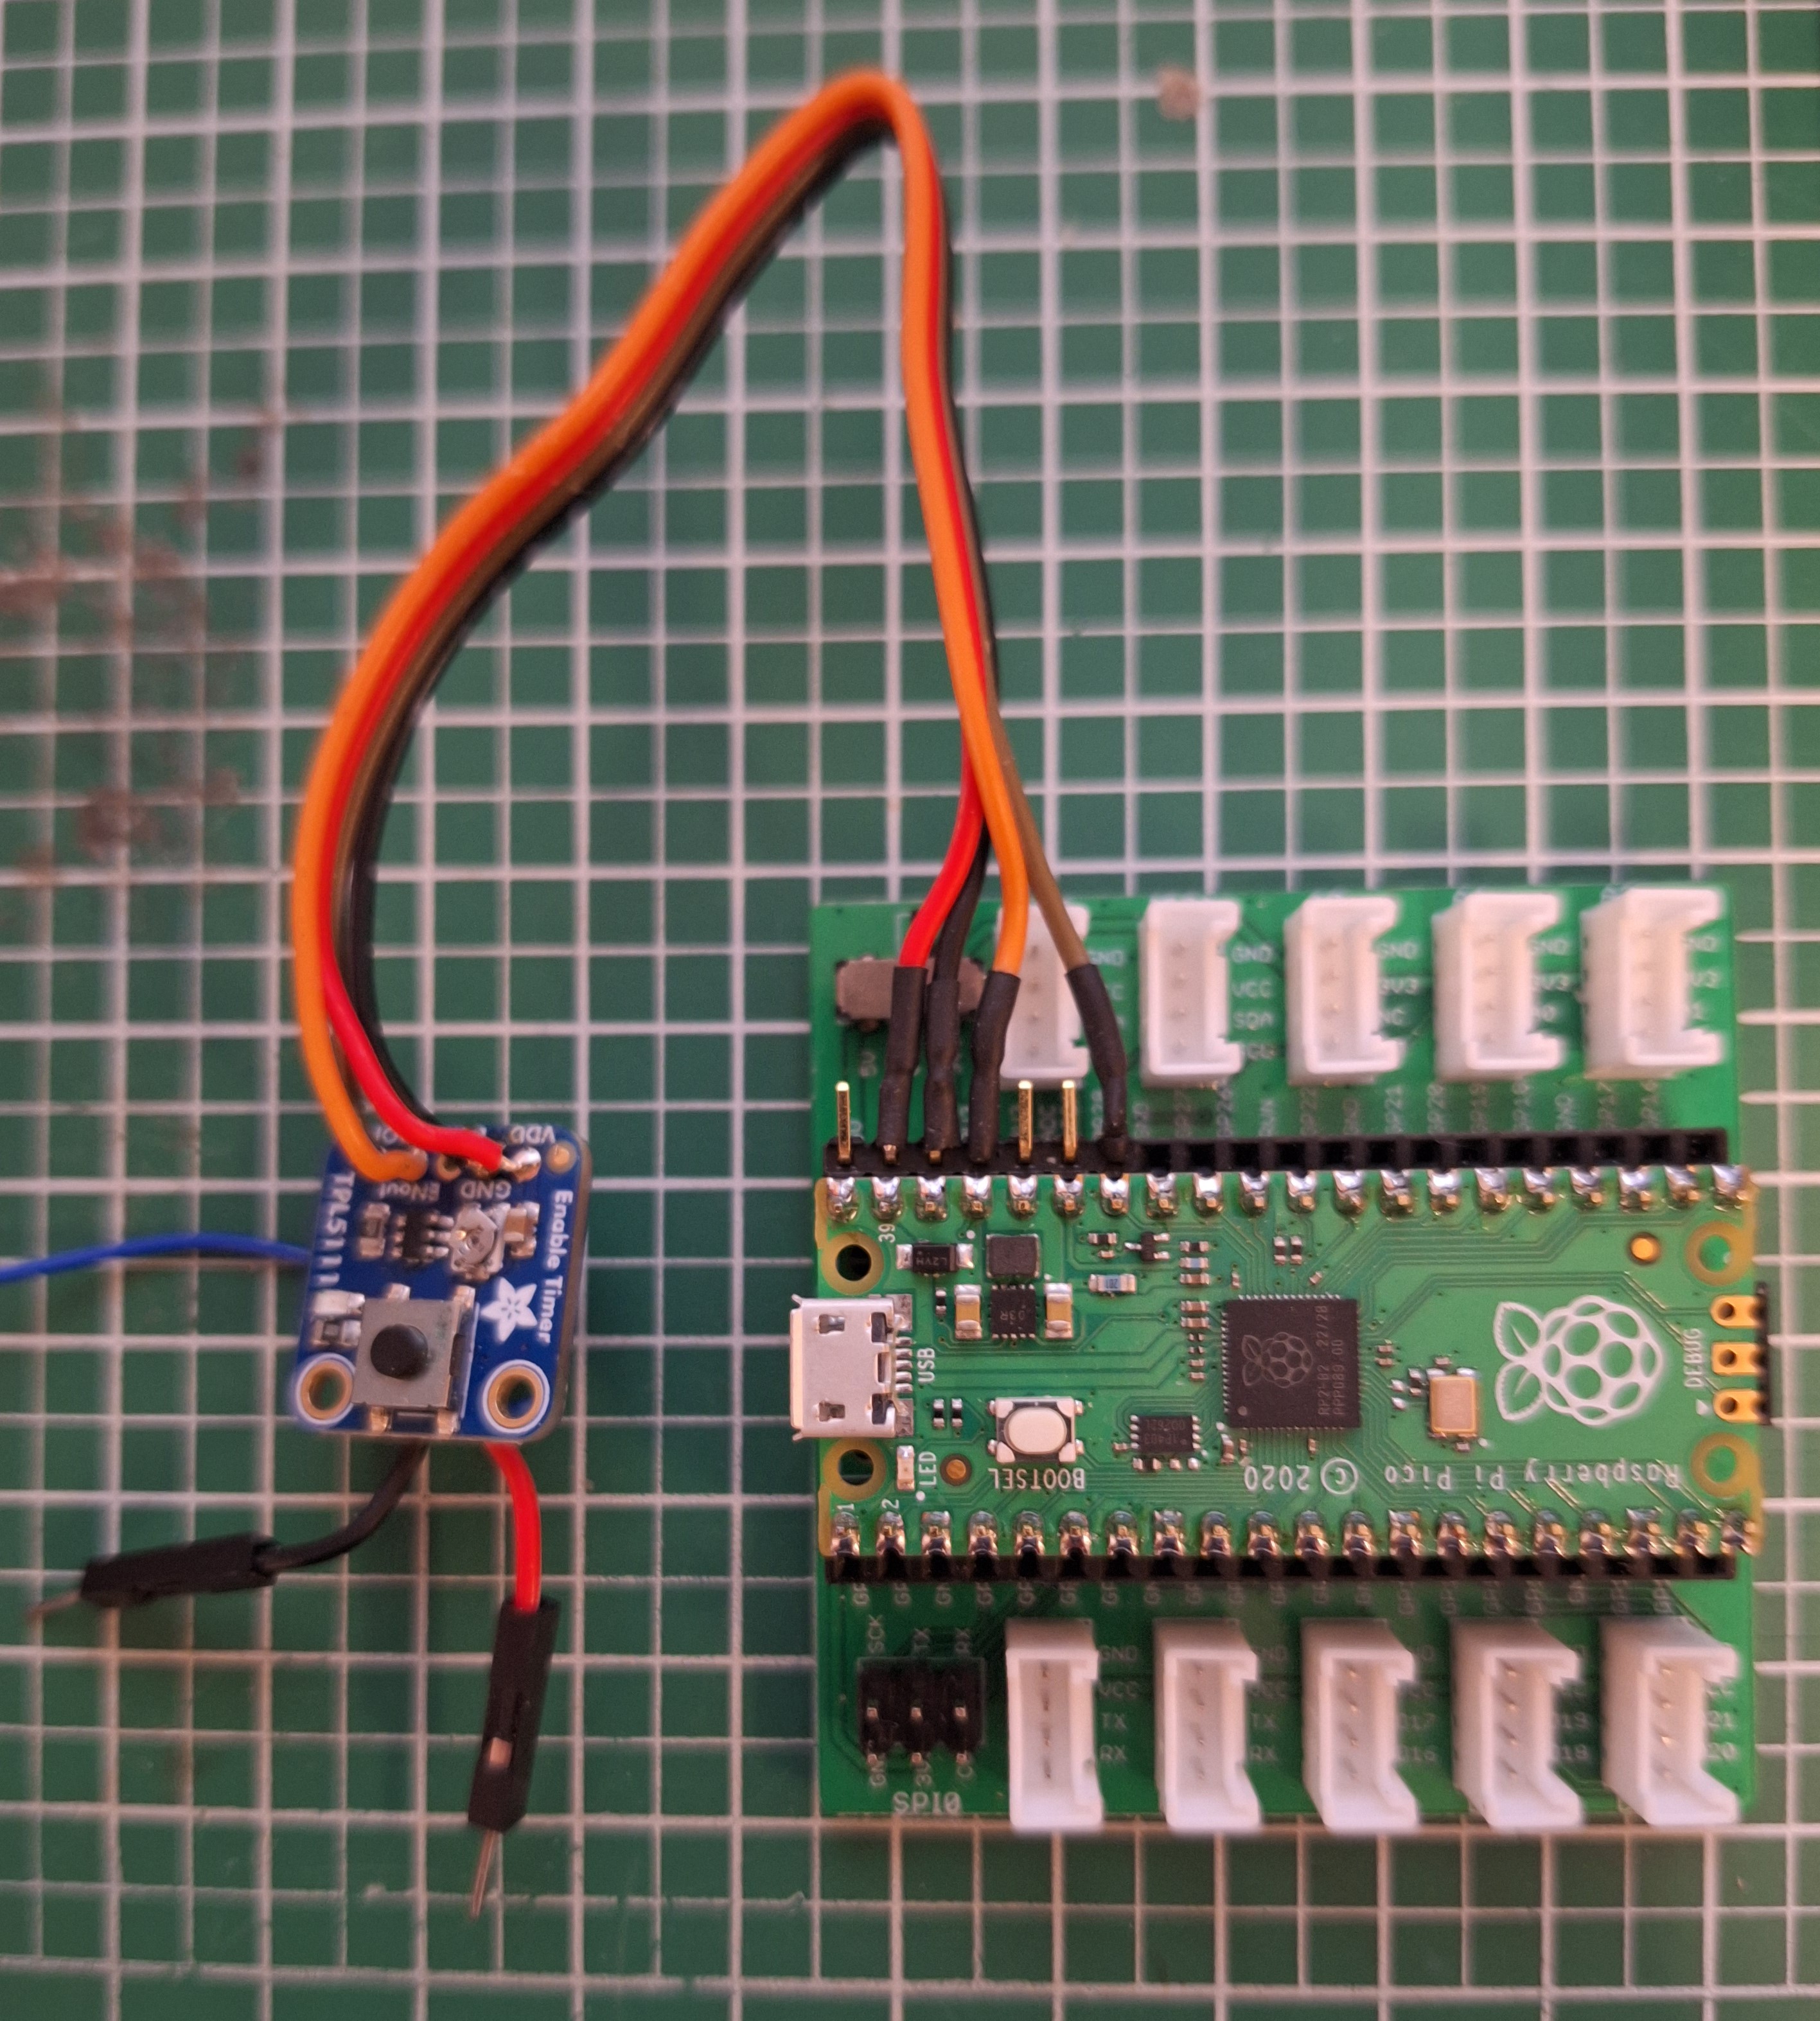
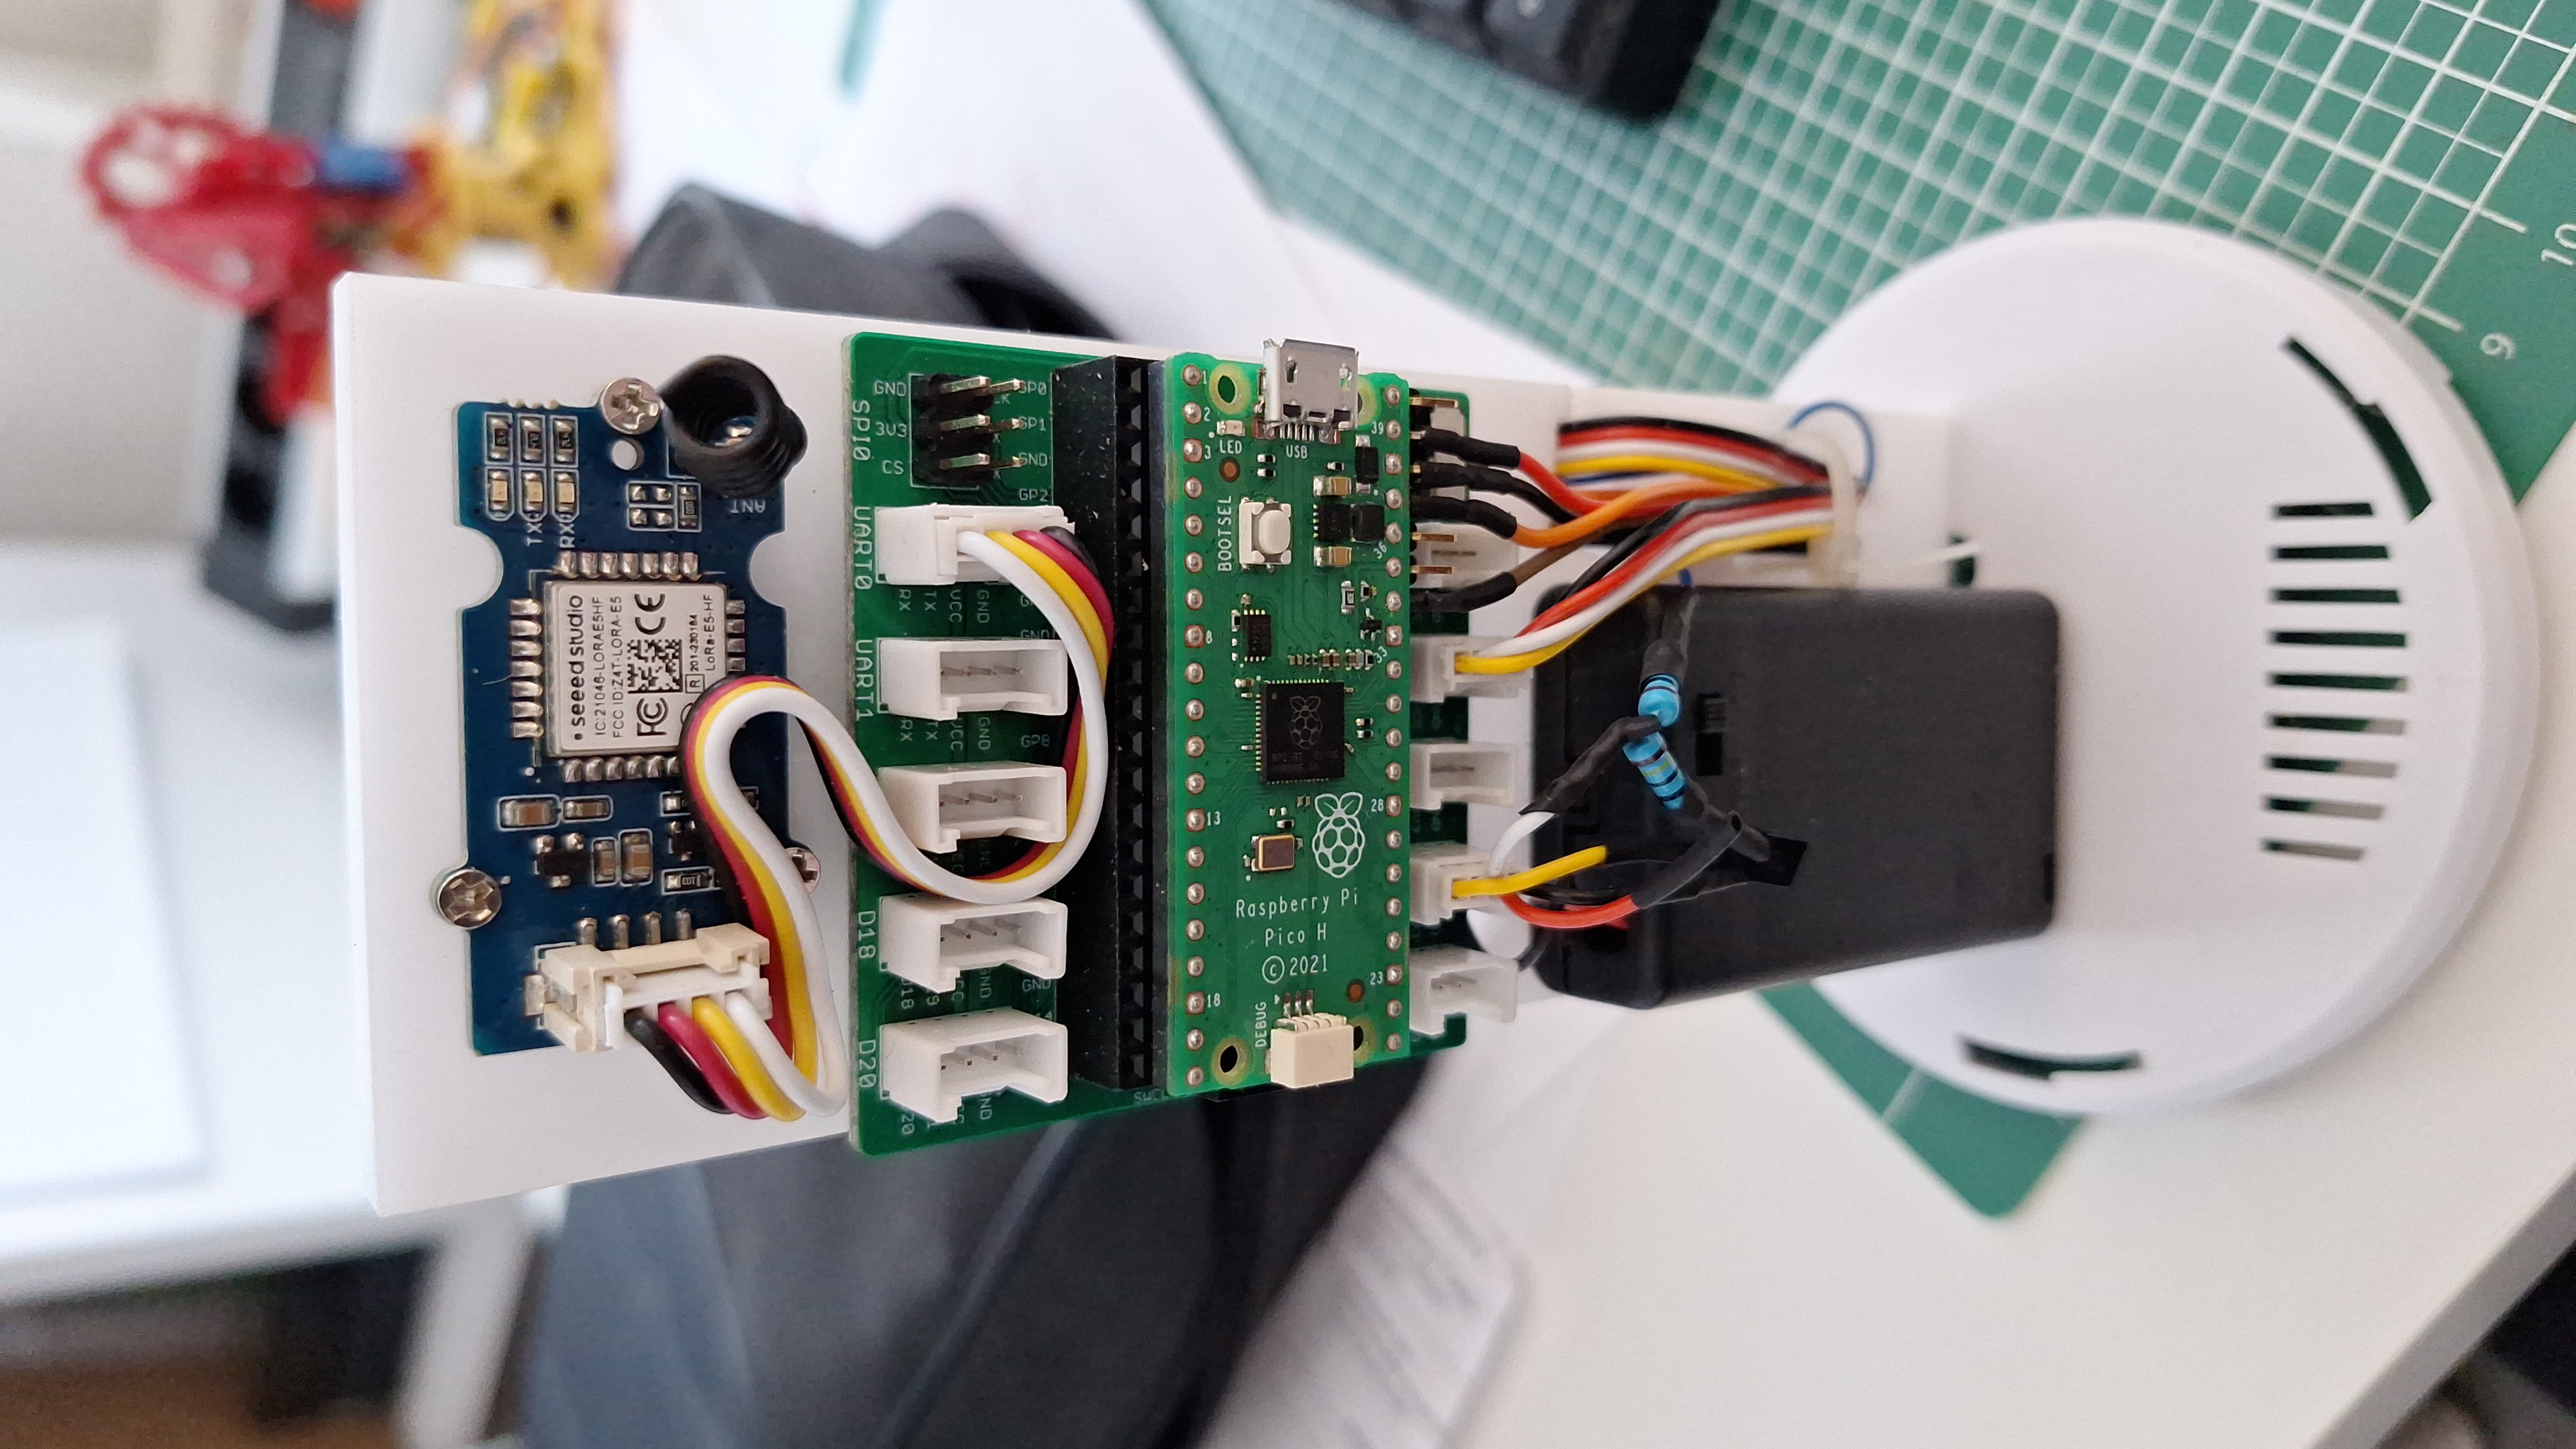
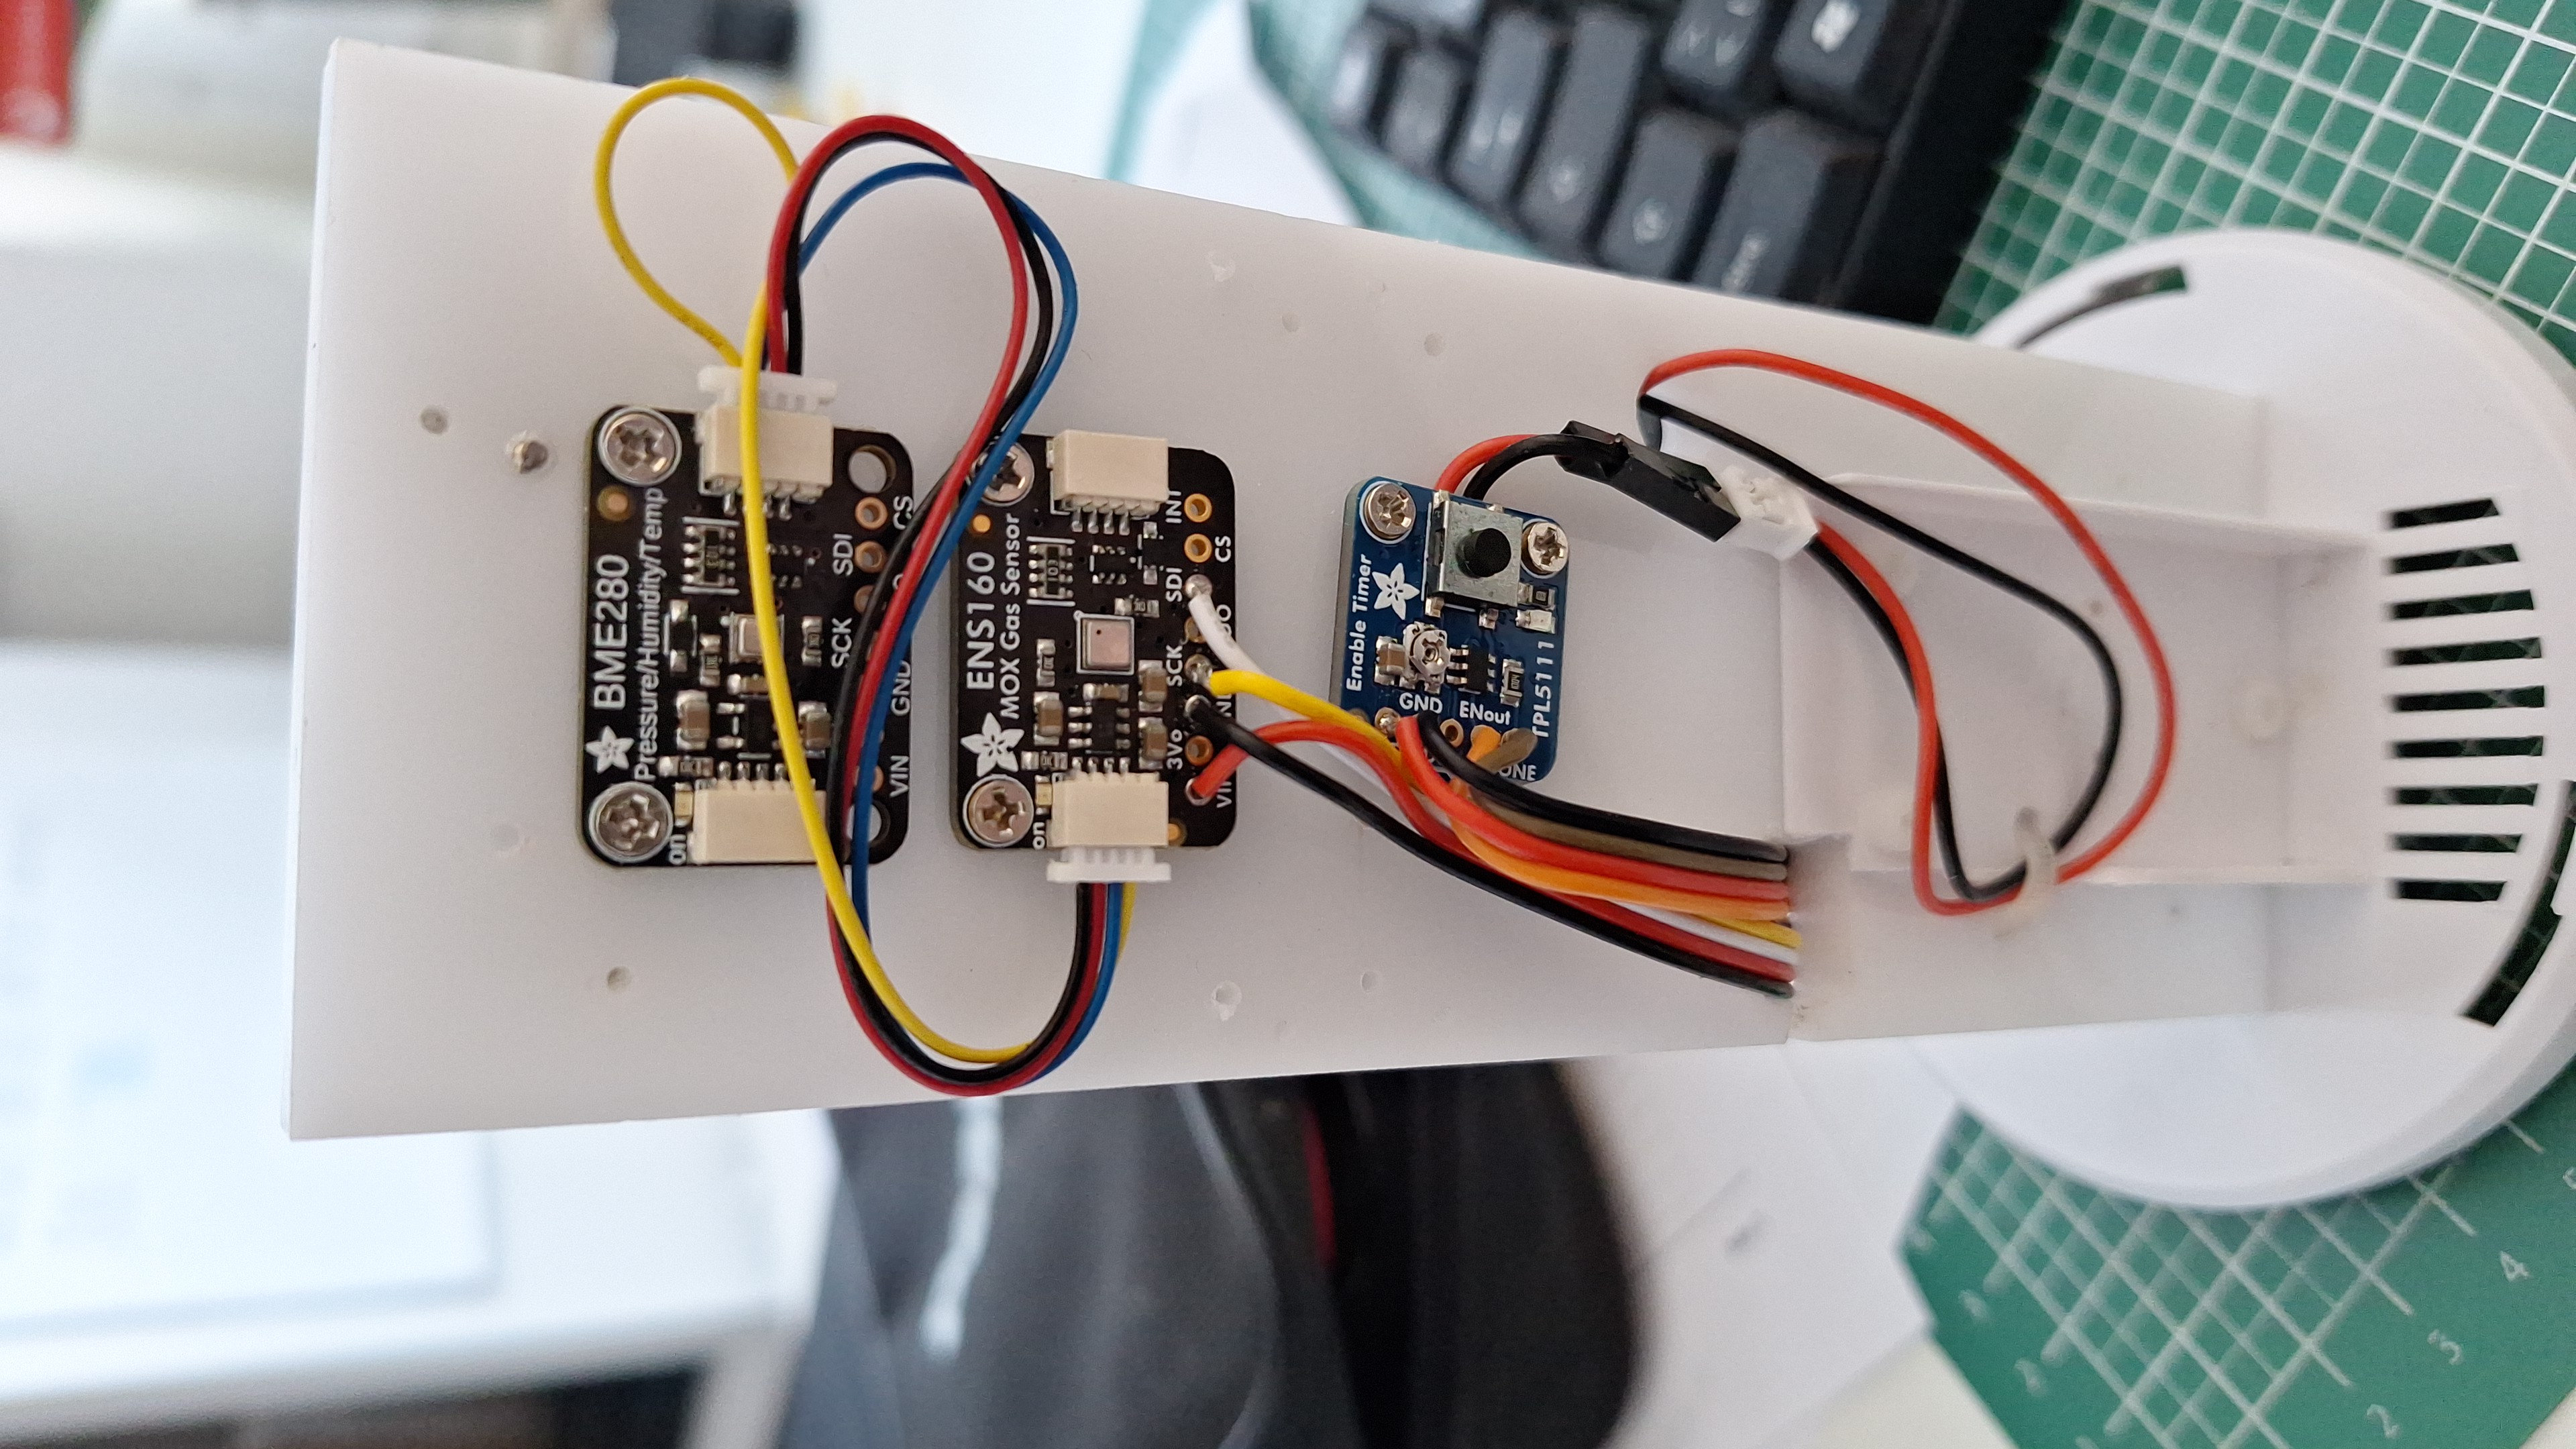
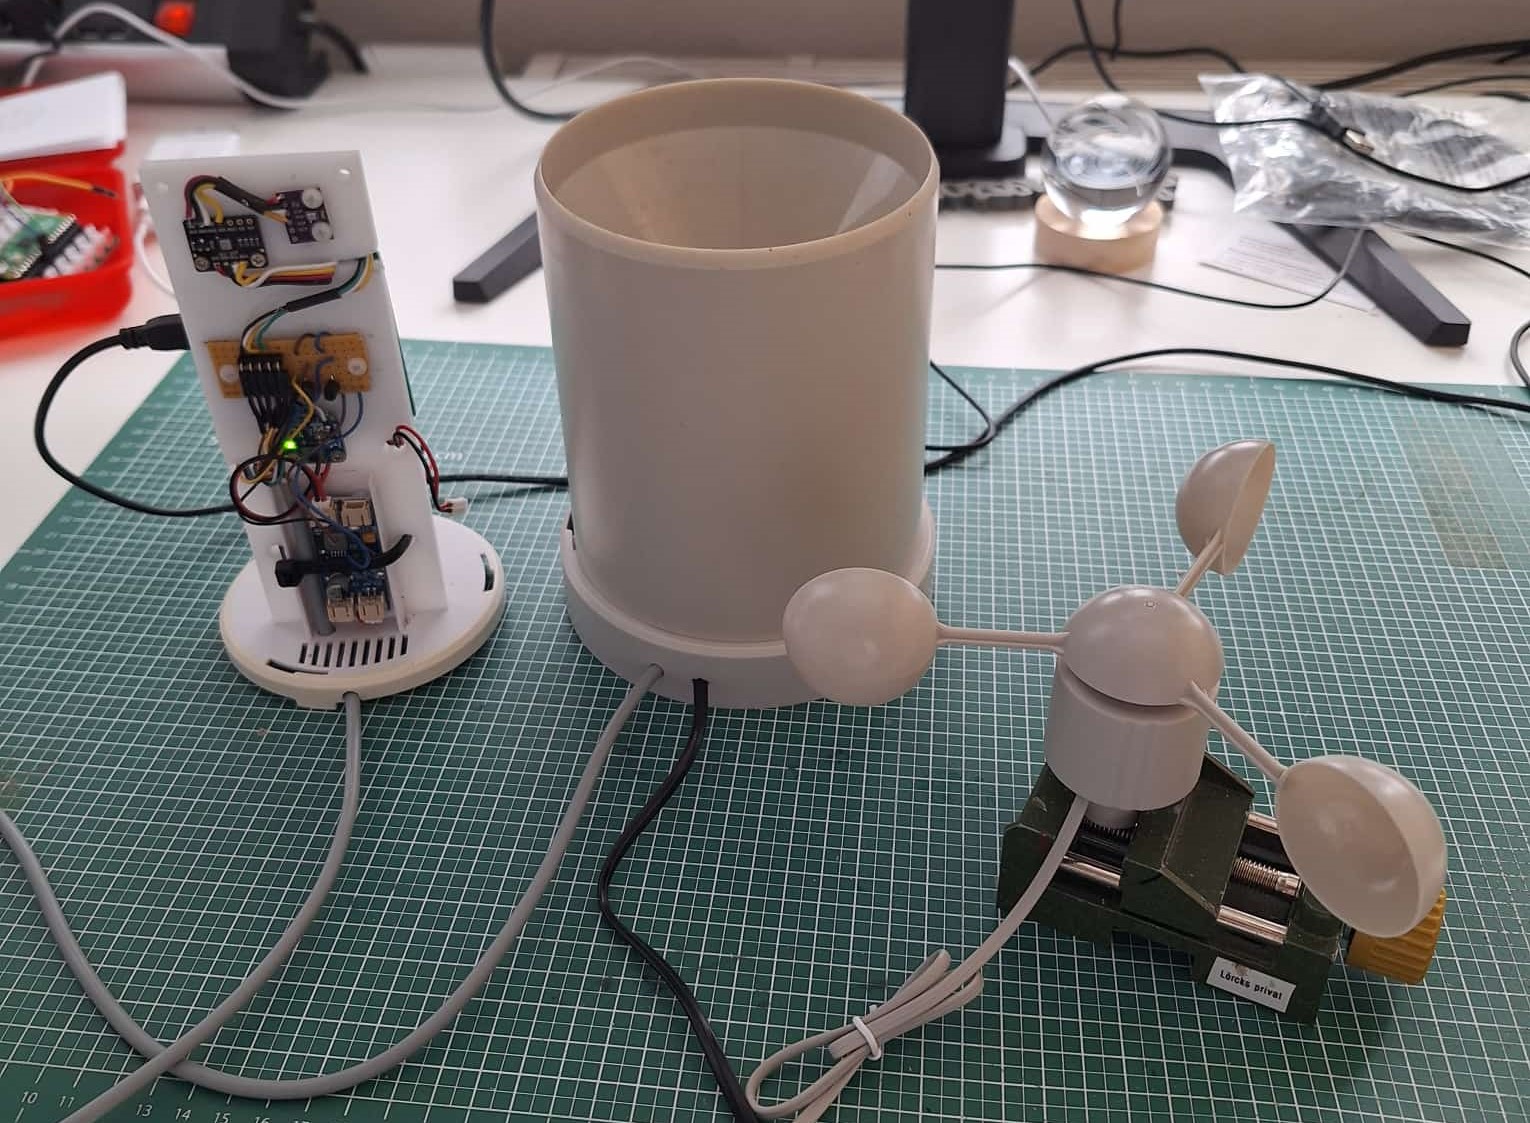
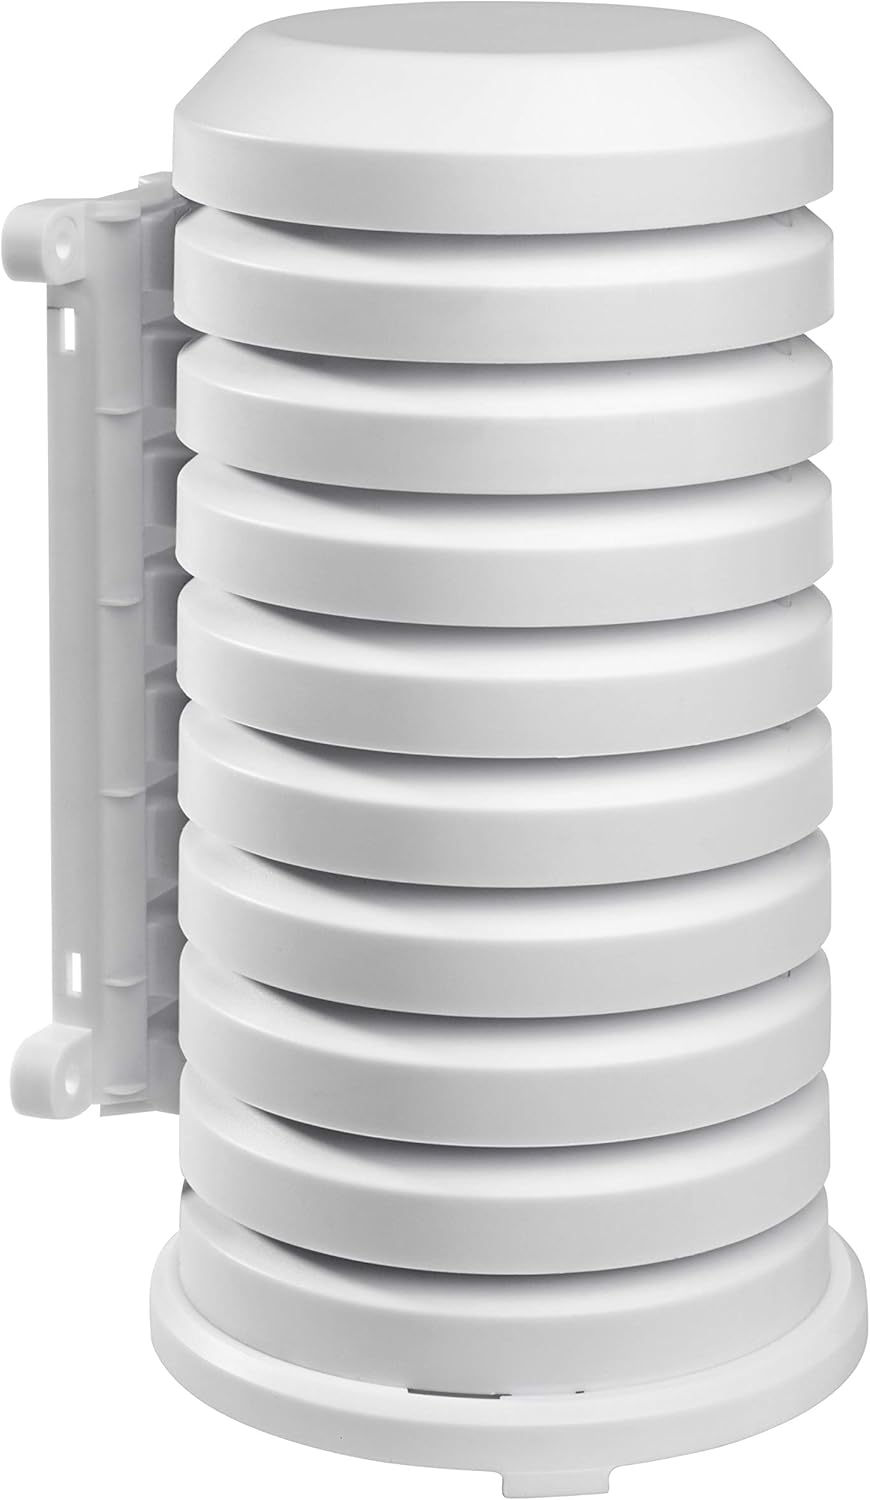 ... to protect the electronics and for hanging up
 +
+ 
 +
+  =
= 


 Contact Information:

Het arrangement Setting up a weather station (by Martin Lörcks) is gemaakt met Wikiwijs van Kennisnet. Wikiwijs is hét onderwijsplatform waar je leermiddelen zoekt, maakt en deelt.
- Auteur
- Laatst gewijzigd
- 17-09-2025 10:01:31
- Licentie
-


Dit lesmateriaal is gepubliceerd onder de Creative Commons Naamsvermelding 4.0 Internationale licentie. Dit houdt in dat je onder de voorwaarde van naamsvermelding vrij bent om:
- het werk te delen - te kopiëren, te verspreiden en door te geven via elk medium of bestandsformaat
- het werk te bewerken - te remixen, te veranderen en afgeleide werken te maken
- voor alle doeleinden, inclusief commerciële doeleinden.
Meer informatie over de CC Naamsvermelding 4.0 Internationale licentie.
Aanvullende informatie over dit lesmateriaal
Van dit lesmateriaal is de volgende aanvullende informatie beschikbaar:
- Toelichting
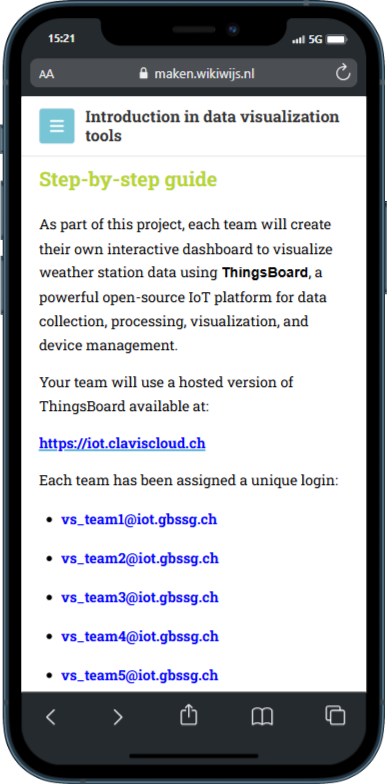
- Setting up a weather station
- Eindgebruiker
- leerling/student
- Moeilijkheidsgraad
- gemiddeld
Gebruikte Wikiwijs Arrangementen
Vetskilling. (z.d.).
Aufbau einer Wetterstation