4.4. Increasing ecological realism in toxicity testing

4.4. Increasing ecological realism in toxicity testing

4.4. Increasing ecological realism in toxicity testing

Author: Michiel Kraak

Reviewer: Kees van Gestel


Learning objectives:

You should be able to

  • argue the need to increase ecological realism in single-species toxicity tests.
  • list the consecutive steps to increase ecological realism in single-species toxicity tests.


Keywords: single-species toxicity tests, mixture toxicity, multistress, chronic toxicity, multigeneration effects, ecological realism.


Introduction

The vast majority of single-species toxicity tests reported in the literature concerns acute or short-term exposures to individual chemicals, in which mortality is often the only endpoint. This is in sharp contrast with the actual situation at contaminated sites, where organisms may be exposed to relatively low levels of mixtures of contaminants under suboptimal conditions for their entire life span. Hence there is an urgent need to increase ecological realism in single-species toxicity tests by addressing sublethal endpoints, mixture toxicity, multistress effects, chronic toxicity and multigeneration effects.


Increasing ecological realism in single-species toxicity tests

Mortality is a crude parameter representing the response of organisms to relatively high and therefore often environmentally irrelevant toxicant concentrations. At much lower and environmentally more relevant toxicant concentrations, organisms may suffer from a wide variety of sublethal effects. Hence, the first step to gain ecological realism in single-species toxicity tests is to address sublethal endpoints instead of, or in addition to mortality (Figure 1). Yet, given the short exposure time in acute toxicity tests it is difficult to assess other endpoints than mortality. Photosynthesis of plants and behaviour of animals are elegant, sensitive and rapidly responding endpoints that can be incorporated into short-term toxicity tests to enhance their ecological realism (see section on Endpoints).

Since organisms are often exposed to relatively low levels of contaminants for their entire life span, the next step to increase ecological realism in single-species toxicity tests is to increase exposure time by performing chronic experiments (Figure 1) (see section on Chronic toxicity). Moreover, in chronic toxicity tests a wide variety of sublethal endpoints can be assessed in addition to mortality, the most common ones being growth and reproduction (see to section on Endpoints). Given the relatively short duration of the life cycle of many invertebrates and unicellular organisms like bacteria and algae, it would be relevant to prolong the exposure time even further, by exposing the test organisms for their entire life span, so from the egg or juvenile phase till adulthood including their reproductive performance, or for several generations, assessing multigeneration effects (Figure 1) (see section on Multigeneration effects).


Figure 1. Consecutive steps of increasing ecological realism in single-species toxicity tests.


In contaminated environments, organisms are generally exposed to a wide variety of toxicants under variable and sub-optimal conditions. To further gain ecological realism, mixture toxicity and multistress scenarios should thus be considered (figure 1) (see sections on Mixture toxicity and Multistress). The highest ecological relevance of laboratory toxicity tests may be achieved by addressing the above mentioned issues all together in one type of experiment, chronic mixture toxicity tests assessing sublethal endpoints. Yet, even nowadays such studies remain scarce.

Another way of increasing ecological realism of toxicity testing is by moving towards multispecies test systems that allow for assessing the impacts of chemicals and other stressors on species interactions within communities (see chapter 5 on Population, community and ecosystem ecotoxicology).

4.4.1. Mixture toxicity

Authors: Michiel Kraak & Kees van Gestel

Reviewer: Thomas Backhaus


Learning objectives:

You should be able to

·         explain the concepts involved in mixture toxicity testing, including Concentration Addition and Response Addition.

·         design mixture toxicity experiments and to understand how the toxicity of (equitoxic) toxicant mixtures is assessed.

·         interpret the results of mixture toxicity experiments and to understand the meaning of Concentration Addition, Response Addition, as well as antagonism and synergism as deviations from Concentration Addition and Response Addition.


Key words: Mixture toxicity, TU summation, equitoxicity, Concentration Addition, Response Addition, Independent Action


Introduction

In contaminated environments, organisms are generally exposed to complex mixtures of toxicants. Hence, there is an urgent need for assessing their joint toxic effects. In theory, there are four classes of joint effects of compounds in a mixture as depicted in Figure 1.


Four classes of joint effects

No interaction

(additive)

Interaction

(non-additive)

Similar action

Simple similar action/

Concentration Addition

Complex similar action

Dissimilar action

Independent action/

Response Addition

Dependent action


Figure 1. The four classes of joint effects of compounds in a mixture, as proposed by Hewlett and Plackett (1959).


Simple similar action & Concentration Addition

The most simple case concerns compounds that share the same mode of action and do not interact (Figure 1 upper left panel: simple similar action). This holds for compounds acting on the same biological pathway, affecting strictly the same molecular target. Hence, the only difference is the relative potency of the compounds. In this case Concentration Addition is taken as the starting point, following the Toxic Unit (TU) approach. This approach expresses the toxic potency of a chemical as TU, which is calculated for each compound in the mixture as:


\(Toxic\quad Unit = {c \over EC_x}\)


with c = the concentration of the compound in the mixture, and ECx = the concentration of the compound where the measured endpoint is affected by X % compared to the non-exposed control. Next, the toxic potency of the mixture is calculated as the sum of the TUs of the individual compounds:


\(TU(mixture)= sum TU(compounds)\quad = \sum {c_i \over EC_{x,1}}\)


Imagine that the EC50 of compound A is 300 μg.L-1 and that of compound B 60 μg.L-1. In a mixture of A+B 30 μg.L-1 A and 30 μg.L-1 B are added. These concentrations represent 30/300 = 0.1 TU of A and 30/60 = 0.5 TU of B. Hence, the mixture consists of 0.1 + 0.5 = 0.6 TU. Yet, the two compounds in this mixture are not represented at equal toxic strength, since this specific mixture is dominated by compound B. To compose mixtures in which the compounds are represented at equal toxic strength, the equitoxicity concept is applied:


1 Equitoxic TU A+B = 0.5 TU A + 0.5 TU B

1 Equitoxic TU A+B = 150 μg.L-1 A + 30 μg.L-1 B


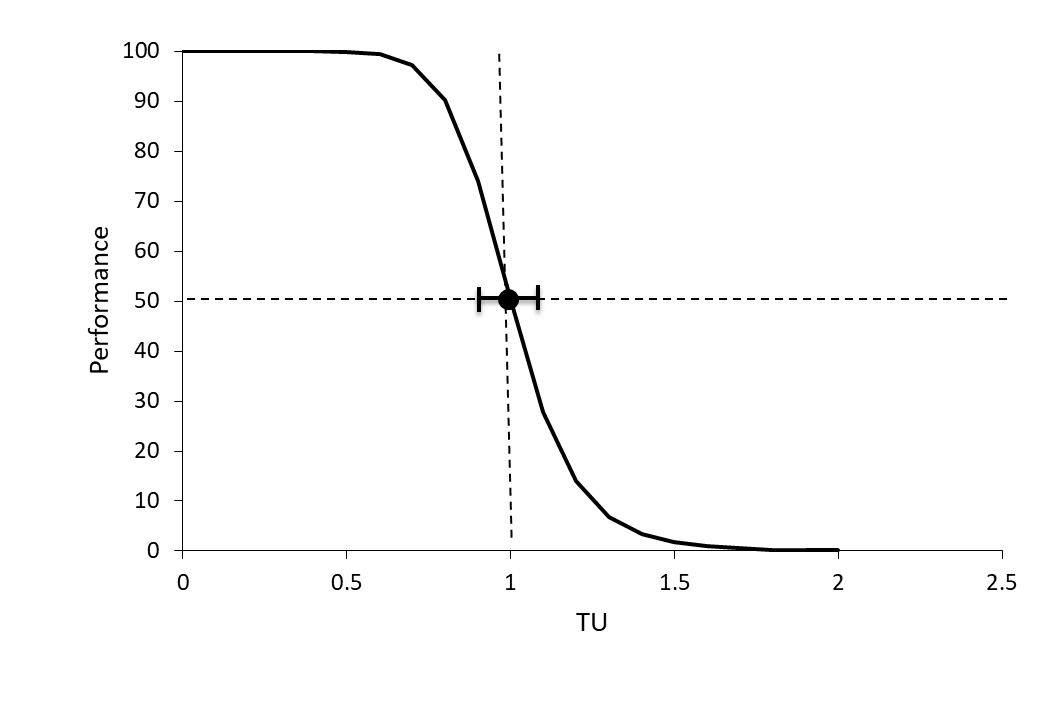
As in traditional concentration-response relationships, survival or a sublethal endpoint is plotted against the mixture concentration from which the EC50 value and the corresponding 95% confidence limits can be derived (see section on Concentration-response relationships). If the upper and lower 95% confidence limits of the EC50 value of the mixture include 1 TU, the EC50 of the mixture does not differ from 1 TU and the toxicity of the compounds in the mixture is indeed concentration additive (Figure 2).


Figure 2. Concentration-response relationship for a mixture in which the toxicants have a concentration additive effect. The Y-axis shows the performance of the test organisms, e.g. their survival, reproduction or other endpoint measured. The horizontal dotted line represents the 50% effect level, the vertical dotted line represents 1 Toxic Unit (TU). The black dot represents the experimental EC50 value of the mixture with the 95% confidence limits.


An experiment appealing to the imagination was performed by Deneer et al. (1988), who tested a mixture of 50 narcotic compounds (see section on Toxicodynamics and Molecular interactions) and observed perfect concentration addition, even when the individual compounds were present at only 0.25% (0.0025 TU) of their EC50. This showed in particular that narcotic compounds present at concentrations way below their no effect level still contribute to the joint toxicity of a mixture (Deneer et al., 1988). This was also shown for metals (Kraak et al., 1999). This is alarming, since even nowadays environmental legislation is still based on a compound-by-compound approach. The study by Deneer et al. (1988) also clearly demonstrated the logistical challenges of mixture toxicity testing. Since for composing equitoxic mixtures the EC50 values of the individual compounds need to be known, testing an equitoxic mixture of 50 compounds requires 51 toxicity tests: 50 individual compounds and 1 mixture.


Independent Action & Response Addition

When chemicals have a different mode of action, act on different targets, but still contribute to the same biological endpoint, the mixture is expected to behave according to Response Addition (also termed Independent Action; Figure 1, lower left panel). Such a situation would occur, for example, if one compound inhibits photosynthesis, and a second one inhibits DNA-replication, but both inhibit the growth of an exposed algal population. To calculate the effect of a mixture of compounds with different modes of action, Response Addition is applied as follows: The probability that a compound, at the concentration at which it is present in the mixture, exerts a toxic effect (scaled from 0 to 1), differs per compound and the cumulative effect of the mixture is the result of combining these probabilities, according to:


E(mix) = E(A) + E(B) – E(A)E(B)


Where E(mix) is the fraction affected by the mixture, and E(A) and E(B) are the fractions affected by the individual compounds A and B at the concentrations at which they occur in the mixture. In fact, this equation sums the fraction affected by compound A and the fraction affected by compound B at the concentration at which they are present in the mixture, and then corrects for the fact that the fraction already affected by chemical A cannot be affected again by chemical B (or vice versa). The latter part of the equation is needed to account for the fact that the chemicals act independent from each other. This is visualised in Figure 3.


Figure 3. Illustration of stressors acting independent of each other, using the example given by Berenbaum (1981). Subsequently a handful of nails and a handful of pebbles are thrown to a collection of eggs. The nails break 5 eggs, and these 5 eggs broken by the nails cannot be broken again. The pebbles could break 4 eggs, but 1 egg was already broken by the nails. Hence, the pebbles break 3 additional eggs.


The equation:                                     E(mix) = E(A) + E(B) – E(A)E(B)


can be rewritten as:                            1-E(mix) = (1-EA)*(1-EB)


This means that the probability of not being affected by the mixture (1-E(mix)) is the product of the probabilities of not being affected by (the specific concentrations of) compound A and compound B. At the EC50, both the affected and the unaffected fraction are 50%, hence (1-EA)*(1-EB) = 0.5. If both compounds equally contribute to the effect of the mixture, (1-EA) = (1-EB) and thus (1-EA or B)2 = 0.5, so both (1-EA) and (1-EB) equal \(\sqrt 0.5\) = 0.71. Since the probability of not being affected is 0.71 for compound A and compound B, the probability of being affected is 0.29. Thus at the EC50 of a mixture of two compounds acting according to Independent Action, both compounds should be present at a concentration equalling their EC29.


Interactions between the compounds in a mixture

Concentration Addition as well as Response Addition both assume that the compounds in a mixture do not interact (see Figure 1). However, in reality, such interactions can occur in all four steps of the toxic action of a mixture. The first step concerns chemical and physicochemical interactions. Compounds in the environment may interact, affecting each other’s bioavailability. For instance, excess of Zn causes Cd to be more available in the soil solution as a result of competition for the same binding sites. The second step involves physiological interactions during uptake by an organism, influencing the toxicokinetics of the compounds, for example by competition for uptake sites at the cell membrane. The third step refers to the internal processing of the compounds, e.g. involving effects on each other’s biotransformation or detoxification (toxicokinetics). The fourth step concerns interactions at the target site(s), i.e. the toxicodynamics during the actual intoxication process. The typical whole organism responses that are recorded in many ecotoxicity tests integrate the last three types of interactions, resulting in deviations from the toxicity predictions from Concentration Addition and Response Addition.


Deviations from Concentration Addition

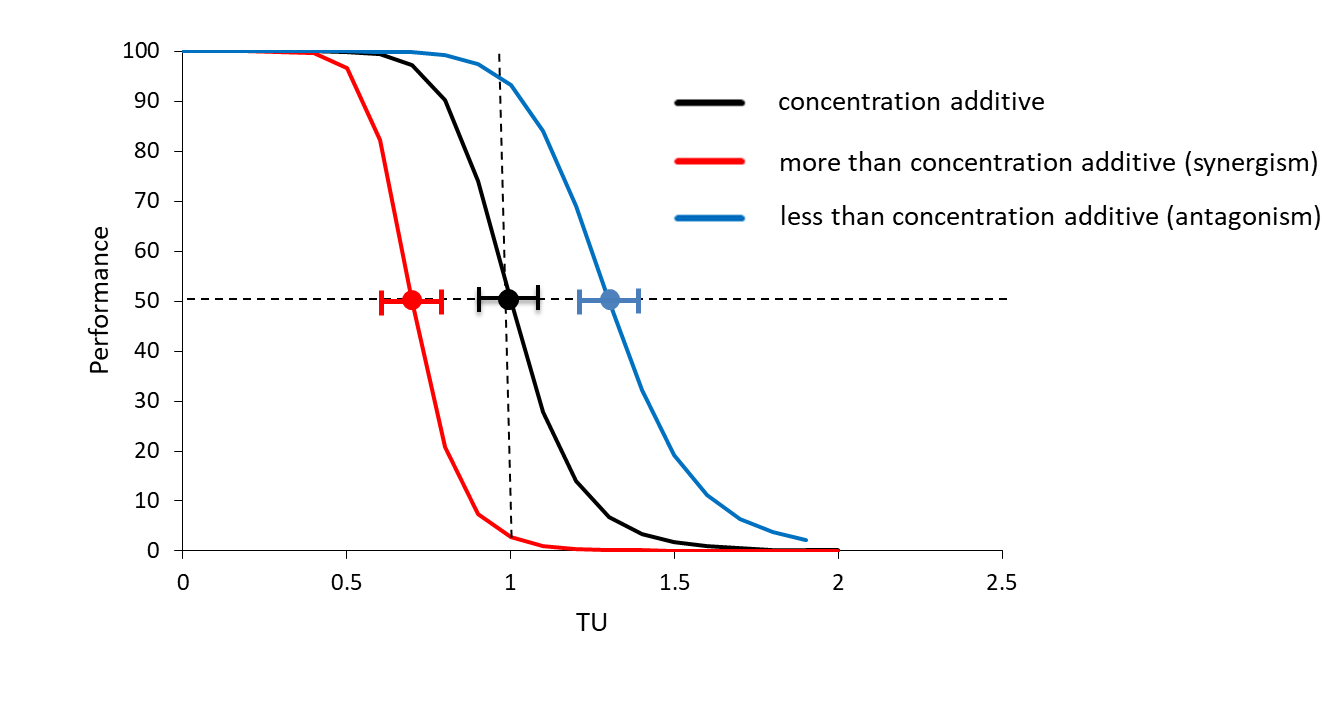
If the EC50 of the mixture is higher than 1 TU and the lower 95% confidence limit is also above 1 TU, the toxicity of the compounds in the mixture is less than concentration additive, as more of the mixture is needed than anticipated to cause 50% effect (Figure 4, blue line; antagonism). Correspondingly, if the EC50 of the mixture is lower than 1 TU and the upper 95% confidence limit is also below 1 TU, the toxicity of the compounds in the mixture is more than concentration additive (Figure 4, red line; synergism).


Figure 4. Concentration-response relationships for mixtures in which the toxicants have a less than concentration additive effect (blue line), a concentration additive effect (black line) and a more than concentration additive effect (red line). The Y-axis shows the performance of the test organisms, e.g. their survival, reproduction or other endpoint measured. The horizontal dotted line represents the 50% effect level, the vertical dotted line represents 1 Toxic Unit (TU). The coloured dots represent the EC50 values with the corresponding 95% confidence limits.


When the toxicity of a mixture is more than concentration additive, the compounds enhance each other’s toxicity. When the toxicity of a mixture is less than concentration additive, the compounds reduce each other’s toxicity. Both types of deviation from additivity can have two different reasons: 1. The compounds have the same mode of action, but do interact (Figure 1, upper right panel: complex similar action). 2. The compounds have different modes of actions (Independent action/Response Addition; Figure 1, lower left panel).


Concentration-response surfaces and isoboles

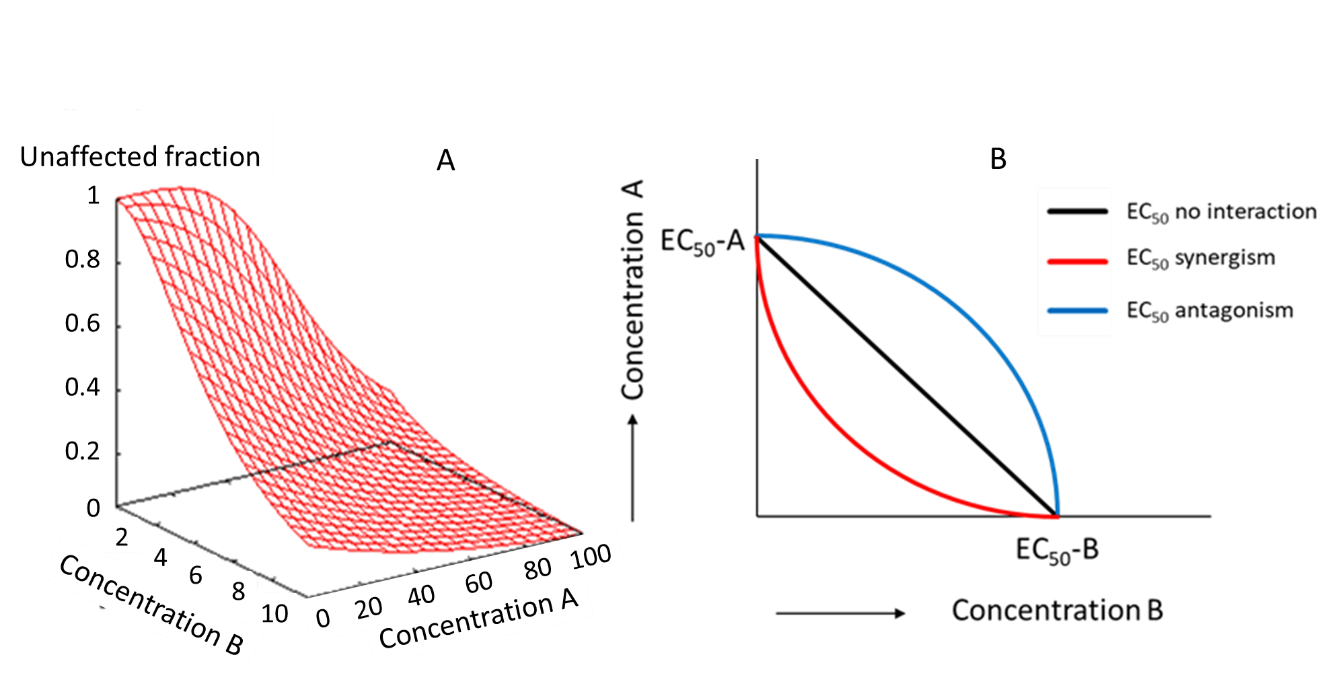
Elaborating on Figure 4, concentration-response relationships for mixtures can also be presented as multi-dimensional figures, with different axes for the concentration of each of the chemicals included in the mixture (Figure 5A). In case of a mixture of two chemicals, such a dose-response surface can be shown in a two-dimensional plane using isoboles. Figure 5B shows isoboles for a mixture of two chemicals, under different assumptions for interactions according to Concentration Addition. If the interaction between the two compounds decreases the toxicity of the mixture, this is referred to as antagonism (Figure 5B, blue line). If the interaction between the two compounds increases the toxicity of the mixture, this is referred to as synergism (Figure 5B, red line). Thus both antagonism and synergism are terms to describe deviations from Concentration Addition due to interaction between the compounds. Yet, antagonism in relation to Concentration Addition (less than concentration additive; Figure 5B blue line) can simply be caused by the compounds behaving according to Response Addition, and not behaving antagonistically.

Figure 5. A. Dose-response surface showing the effect of chemicals A and B, single (sides of the surface), and in mixtures. B. Isoboles showing the toxicity of the same mixtures in a two-dimensional plane. The isoboles can be seen as a cross section through the dose-response surface. The isoboles show the 50% effect level according to Concentration Addition of mixtures of the two compounds in case they do not interact (black line), when they interact antagonistically (blue line) and when they interact synergistically (red line).


Synergism and antagonism evaluated by both concepts

The use of the terms synergism and antagonism may be problematic, because antagonism in relation to Concentration Addition (less than concentration additive; Figure 5B blue line) can simply be caused by the compounds behaving according to Response Addition, and not behaving antagonistically. Similarly, deviations from Response Addition could also mean that chemicals in the mixture do have the same mode of action, so act additively according to Concentration Addition. One can therefore only conclude on synergism/antagonism if the experimental observations are higher/lower than the predictions by both concepts.


Suggested further reading

Rider, C.V., Simmons, J.E. (2018). Chemical Mixtures and Combined Chemical and Nonchemical Stressors: Exposure, Toxicity, Analysis, and Risk, Springer International Publishing AG. ISBN-13: 978-3319562322.

Bopp, S.K., Kienzler, A., Van der Linden, S., Lamon, L., Paini, A., Parissis, N., Richarz, A.N., Triebe, J., Worth, A. (2016). Review of case studies on the human and environmental risk assessment of chemical mixtures. JRC Technical Reports EUR 27968 EN, European Union, doi:10.2788/272583.


References

Berenbaum, M.C. (1981). Criteria for analysing interactions between biologically active agents. Advances in Cancer Research 35, 269-335.

Deneer, J.W., Sinnige, T.L., Seinen, W., Hermens, J.L.M. (1988). The joint acute toxicity to Daphnia magna of industrial organic chemicals at low concentrations. Aquatic Toxicology 12, 33–38.

Hewlett, P.S., Plackett, R.L. (1959). A unified theory for quantal responses to mixtures of drugs: non-interactive action. Biometrics 15, 691 610.

Kraak, M.H.S., Stuijfzand, S.C., Admiraal, W. (1999). Short-term ecotoxicity of a mixture of five metals to the zebra mussel Dreissena polymorpha. Bulletin of Environmental Contamination and Toxicology 63, 805-812.

Van Gestel, C.A.M., Jonker, M.J., Kammenga, J.E., Laskowski, R., Svendsen, C. (Eds.) (2011). Mixture toxicity. Linking approaches from ecological and human toxicology. SETAC Press, Society of Environmental Toxicology and Chemistry, Pensacola.


4.4.2. Multistress Introduction

Author: Michiel Kraak

Reviewer: Kees van Gestel


Learning objectives:

You should be able to

·         define stress and multistress.

·         explain the ecological relevance of multistress scenarios.


Keywords: Stress, multistress, chemical-abiotic interactions, chemical-biotic interactions


Introduction

In contaminated environments, organisms are generally exposed to a wide variety of toxicants under variable and sub-optimal conditions. To gain ecological realism, multistress scenarios should thus be considered, but these are, however, understudied.


Definitions

Stress is defined as an environmental change that affects the fitness and ecological functioning of species (i.e., growth, reproduction, behaviour), ultimately leading to changes in community structure and ecosystem functioning. Multistress is subsequently defined as a situation in which an organism is exposed both to a toxicant and to stressful environmental conditions. This includes chemical-abiotic interactions, chemical-biotic interactions as well as combinations of these. Common abiotic stressors are for instance pH, drought, salinity and above all temperature, while common biotic stressors include predation, competition, population density and food shortage. Experiments on such stressors typically study, for instance, the effect of increasing temperature or the influence of food availability on the toxicity of compounds.

The present definition of multistress thus excludes mixture toxicity (see section on Mixture toxicity) as well as situations in which organisms are confronted with several suboptimal (a)biotic environmental variables jointly without being exposed to toxicants. The next chapters deal with chemical-abiotic and chemical-biotic interactions and with practical issues related with the performance of multistress experiments, respectively.

4.4.3. Multistress - biotic

Authors: Marjolein Van Ginneken and Lieven Bervoets

Reviewers: Michiel Kraak and Martin Holmstrup


Learning objectives:

You should be able to

  • define biotic stress and to give three examples.
  • explain how biotic stressors can change the toxicity of chemicals
  • explain how chemicals can change the way organisms react to biotic stressors


Keywords: Multistress, chemical-biotic interactions, stressor interactions, bioavailability, behavior, energy trade-off


Introduction

Generally, organisms have to cope with the joint presence of chemical and natural stressors. Both biotic and abiotic stressors can affect the chemicals’ bioavailability and toxicokinetics. Additionally, they can influence the behavior and physiology of organisms, which could result in higher or lower toxic effects. Vice versa, chemicals can alter the way organisms react to natural stressors.

By studying the effects of multiple stressors, we can identify potential synergistic, additive or antagonistic interactions, which are essential to adequately assess the risk of chemicals in nature. Relyea (2003), for instance, found that apparently safe concentrations of carbaryl can become deadly to some amphibian species when combined with predator cues. This section focuses on biotic stress, which can be defined as stress caused by living organisms and includes predation, competition, population density, food availability, pathogens and parasitism. It will describe how biotic stressors and chemicals act and interact.


Types of biotic stressors

Biotic stressors can have direct and indirect effects on organisms. For example, predators can change food web structures by consuming their prey and thus altering prey abundance and can indirectly affect prey growth and development as well, by inducing energetically-costly defense mechanisms. Also behaviors like (foraging) activity can be decreased and even morphological changes can be induced. For example, Daphnia pulex can develop neck spines when they are subject to predation. Similarly, parasites can alter host behavior or induce morphological changes, e.g., in coloration, but they usually do not kill their host. Yet, parasitism can compromise the immune system and alter the energy budget of the host.

High population density is a stressor that can affect energy budgets and intraspecific and interspecific competition for space, status or resources. By altering resource availability, changes in growth and size at maturity can be the result. Additionally, these competition-related stressors can affect behavior, for example by limiting the number of suitable mating partners. Also pathogens (e.g., viruses, bacteria and fungi) can lower fitness and fecundity.

It should be realized that the effects of different biotic stressors cannot be strictly separated from each other. For example, pathogens can spread more rapidly when population densities are high, while predation, on the other hand, can limit competition.


Effects of biotic stressors on bioavailability and toxicokinetics

Biotic stressors can alter the bioavailability of chemicals. For example in the aquatic environment, food level may determine the availability of chemicals to filter feeders, as they may adsorb to particulate organic matter, such as algae. As the exposure route (waterborne or via food) can influence the subsequent toxicokinetic processes, this may also change the chemicals’ toxic effects.


Effects of biotic stressors on behavior

Biotic stressors have been reported to cause behavioral effects in organisms that could change the toxic effects of chemicals. These effects include altered feeding rates and reduced activities. The presence of a predator, for example, reduces prey (foraging) activity to avoid being detected by the perceived predator and so decreases chemical uptake via food. On the other hand, the condition of the prey organisms will decrease due to the lower food consumption, which means less energy is available for other physiological processes (see below).

In addition to biotic stressors, also chemicals can disrupt essential behaviors by reduction of olfactory receptor sensitivity, cholinesterase inhibition, alterations in brain neurotransmitter levels, and impaired gonadal or thyroid hormone levels. This could lead to disruptive effects on communication, feeding rates and reproduction. An inability to find mating partners, for example, could then be worsened by a low population density. Furthermore, chemicals can alter predator-prey relationships, which might result in trophic cascades. Strong top-down effects will be observed when a predator or grazer is more sensitive to the contaminant than its prey. Alternatively, bottom-up effects are observed when the susceptibility of a prey species to predation is increased. For example, Cu exposure of fish and crustaceans can decrease their response to olfactory cues, making them unresponsive to predator stress and increasing the risk to be detected and consumed (Van Ginneken et al., 2018). Effects on the competition between species may also occur, when one species is more sensitive than the other. Thus, both chemical and biotic stressors can alter behavior and result in interactive effects that could change the entire ecosystem structure and function (Fleeger et al., 2003).


Physiology

Biotic stressors can cause elevated respiration rates of organisms, in aquatic organisms leading to a higher toxicant uptake through diffusion. On the other hand, they can also decrease respiration. For example, low food levels decrease metabolic activity and thus respiration. Additionally, a reduced metabolic rate could decrease the toxicity of chemicals which are metabolically activated. Also certain chemicals, such as metals, can cause a higher or lower oxygen consumption, which might counteract or reinforce the effects of biotic stressors.

Besides affecting respiration, both biotic and chemical stressors can induce physiological damage to organisms. For instance, predator stress and pesticides cause oxidative stress, leading to synergistic effects on the induction of antioxidant enzymes such as catalase and superoxide dismutase (Janssens and Stoks, 2013). Furthermore, the organism can eliminate or detoxify internal toxicant concentrations, e.g. by transformation via Mixed Function Oxidation enzymes (MFO) or by sequestration, i.e. binding to metallothioneins or storage in inert tissues such as granules. These defensive mechanisms for detoxification and damage control are energetically costly, leading to energy trade-offs. This means less energy can be used for other processes such as growth, locomotion or reproduction. Food availability and lipid reserves can then play an important role, as well-fed organisms that are exposed to toxicants can more easily pay the energy costs than food-deprived organisms.


Interactive effects

The possible interactions, i.e. antagonism, synergism or additivity, between effects of stressors are difficult to predict and can differ depending on the stressor combination, chemical concentration, the endpoint and the species. For Ceriodaphnia dubia, Qin et al. (2011) demonstrated that predator stress influenced the toxic effects of several pesticides differently. While predator cues interacted antagonistically with bifenthrin and thiacloprid, they acted synergistically with fipronil.

It should also be noted that interactive effects in nature might be weaker than when observed in the laboratory as stress levels fluctuate more rapidly or animals can move away from areas with high predator risk or chemical exposure levels. On the other hand, because generally more than two stressors are present in ecosystems, which could interact in an additive or synergistic way as well, they might be even more important in nature. Understanding interactions among multiple stressors is thus essential to estimate the actual impact of chemicals in nature.


References

Fleeger, J.W., Carman, K.R., Nisbet, R.M. (2003). Indirect effects of contaminants in aquatic ecosystems. Science of the Total Environment 317, 207-233.

Janssens, L., Stoks, R. (2013). Synergistic effects between pesticide stress and predator cues: conflicting results from life history and physiology in the damselfly Enallagma cyathigerum. Aquatic Toxicology 132, 92-99.

Qin, G., Presley, S.M., Anderson, T.A., Gao, W., Maul, J.D. (2011). Effects of predator cues on pesticide toxicity: toward an understanding of the mechanism of the interaction. Environmental Toxicology and Chemistry 30, 1926-1934.

Relyea, R.A. (2003). Predator cues and pesticides: a double dose of danger for amphibians. Ecological Applications 13, 1515-1521.

Van Ginneken, M., Blust, R., Bervoets, L. (2018). Combined effects of metal mixtures and predator stress on the freshwater isopod Asellus aquaticus. Aquatic Toxicology 200, 148-157.

4.4.4. Multistress - abiotic

Author: Martina Vijver

Reviewers: Kees van Gestel, Michiel Kraak, Martin Holmstrup


Learning objectives:

You should be able to

  • relate stress to the ecological niche concept
  • list abiotic factors that may alter the toxic effects of chemicals on organisms, and indicate if these abiotic factors decrease or increase the toxic effects of chemicals on organisms


Key words: Stress, ecological niche concept, multistress, chemical-abiotic interactions


Introduction: stress related to the ecological niche concept

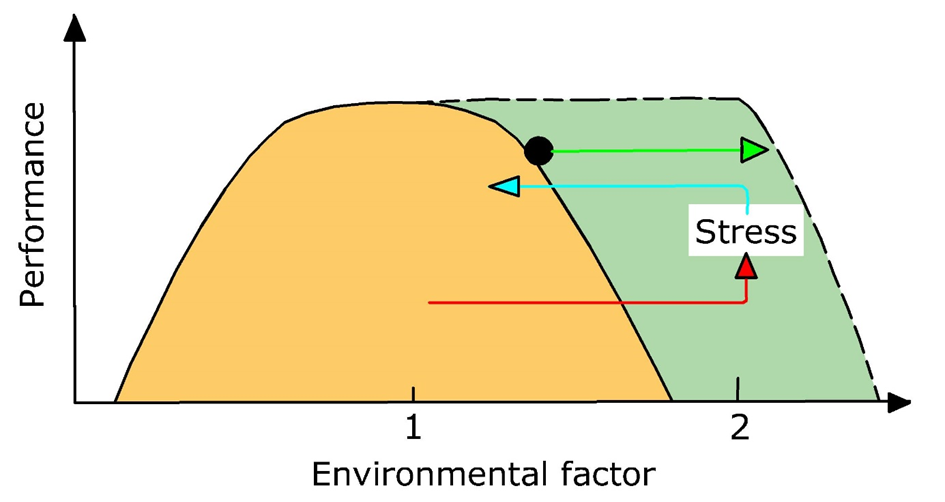
The concept of stress can be defined at various levels of biological organization, from biochemistry to species fitness, ultimately leading to changes in community structure and ecosystem functioning. Yet, stress is most often studied in the context of individual organisms. The concept of stress is not absolute and can only be defined with reference to the normal range of ecological functioning. This is the case when organisms are within their range of tolerance (so-called ecological amplitude) or within their ecological niche, which describes the match of a species to specific environmental conditions. Applying this concept to stress allows it to be defined as a condition evoked in an organism by one or more environmental factors that bring the organism near or over the edges of its ecological niche (Van Straalen, 2003), see Figure 1.


Figure 1. Schematic illustration of the ecological amplitude or niche-based (bell shaped curve) definition of stress. Stress arises when an environmental factor increases from point 1 to point 2 (red line) and the species is forced outside its ecological niche. By definition, the organism cannot grow and reproduce outside this niche, but it may survive there temporarily, if it can return in time to its niche (blue line). If the borders of the niche are extended through adaptation, then this specific state of the environmental factor does not result in stress anymore and the performance of the species falls within the normal operating range at that condition (green line). Redrawn from Van Straalen (2003) by Wilma IJzerman.


Multistress is subsequently defined as a situation in which an organism is exposed both to a toxicant and to stressful environmental conditions (see section Multistress – Introduction and definitions). This includes chemical-abiotic interactions, chemical-biotic interactions (see section Multistress – chemical – biotic interactions) as well as combinations of these. In general, organisms living under conditions close to their environmental tolerance limits appear to be more vulnerable to additional chemical stress. The opposite also holds: if organisms are stressed due to exposure to elevated levels of contaminants, their ability to cope with sub-optimal environmental conditions is reduced.


Chemical-abiotic interactions

Temperature. One of the predominant environmental factors altering toxic effects obviously is temperature. For poikilothermic (cold-blooded) organisms, increases in temperature lead to an increase in activity, which may affect both the uptake and the effects of chemicals. In a review by Heugens et al. (2001), studies reporting the effect chemicals on aquatic organisms in combination with abiotic factors like temperature, nutritional state and salinity were discussed. Generally, toxic effects increased with increasing temperature. Dependent on the effect parameter studied, the differences in toxic effects between laboratory and relevant field temperatures ranged from a factor of 2 to 130.

Also freezing temperatures may interfere with chemical effects as was shown in another influential review of Holmstrup et al. (2010). Membrane damage is mentioned as an explanation for the synergistic interaction between combinations of metals and temperatures below zero.


Food. Food availability may have a strong effect on the sensitivity of organisms to chemicals (see section Multistress – chemical – biotic interactions). In general decreasing food or nutrient levels increased toxicity, resulting in differences in toxicity between laboratory and relevant field situations ranging from a factor of 1.2 to 10 (Heugens et al., 2001). Yet, way higher differences in toxic effects related to food levels have been reported as well: Experiments performed with daphnids in cages that were placed in outdoor mesocosm ditches (see sections on Cosm studies and In situ bioassays) showed stunning differences in sensitivity to the insecticide thiacloprid. Under conditions of low to ambient nutrient concentrations, the observed toxicity, expressed as the lowest observed effect concentration (LOEC) for growth and reproduction occurred at thiacloprid concentrations that were 2500-fold lower than laboratory-derived LOEC values. Contrary to the low nutrient treatment, such altered toxicity was often not observed under nutrient-enriched conditions (Barmentlo et al submitted). The difference was likely attributable to the increased primary production that allowed for compensatory feeding and perhaps also reduced the bioavailability of the insecticide. Similar results were observed for sub-lethal endpoints measured on the damselfly species Ischnura elegans, for which the response to thiacloprid exposure strongly depended on food availability and quality. Damselfies that were feeding on natural resources were significantly more affected than those that were offered high quality artificial food (Barmentlo et al submitted).


Salinity. The influence of salinity on toxicity is less clear (Heugens et al. 2001). If salinity pushes the organism towards its niche boundaries, it will worsen the toxic effects that it is experiencing. In case that a specific salinity fits in the ecological niche of the organism, processes affecting exposure will predominantly determine the stress it will experience. This for instance means that metal toxicity decreases with increasing salinity, as it is strongly affected by the competition of ions (see section on Metal speciation). The toxic effect induced by organophosphate insecticides however, increases with increasing salinity. For other chemicals, no clear relationship between toxicity and salinity was observed. A salinity increase from freshwater to marine water decreased toxicity by a factor of 2.1 (Heugens et al. 2001). However, as less extreme salinity changes are more relevant under field conditions, the change in toxicity is probably much smaller.


pH. Many organisms have a species-specific range of pH levels at which they function optimally. At pH values outside the optimal range, organisms may show reduced reproduction and growth, in extreme cases even reduced survival. In some cases, the effects of pH may be indirect, as pH may also have an important impact on exposure of organisms to toxicants. This is especially the case for metals and ionizable chemicals: metal speciation, but also the form in which ionizable chemicals occur in the environment and therefore their bioavailability, is highly dependent on pH (see sections on Metal speciation and Ionogenic organic chemicals). An example of the interaction between pH and metal effects was shown by Crommentuijn et al. (1997), who observed a reduced control reproduction of the springtail Folsomia candida, but also the lowest cadmium toxicity at a soil pHKCl 7.0 compared to pHKCl 3.1-5.7.


Drought. In soil, the moisture content (see section on Soil) is an important factor, since drought is often limiting the suitability of the soil as a habitat for organisms. Holmstrup et al. (2010), reviewing the literature, concluded that chemicals interfering with the drought tolerance of soil organisms, e.g. by affecting the functioning of membranes or the accumulation of sugars, may exacerbate the effects of drought. Earthworms are breathing through the skin and can only survive in moist soils, and the eggs of springtails can only survive at a relative air humidity close to 100%. This makes these organisms especially sensitive to drought, which may be enhanced by exposure to chemicals like metals, polycyclic aromatic hydrocarbon or surfactants (Holmstrup et al., 2010).


Many different abiotic conditions, such as oxygen levels, light, turbidity, and organic matter content, can push organisms towards the boundaries of their niche, but we will not discuss all stressors in this book.


Multistress in environmental risk assessment

In environmental risk assessment, differences between stress-induced effects as determined in the laboratory under standardized optimal conditions with a single toxicant and the effects induced by multiple stressors are taken into account by applying an uncertainty factor. Yet, the choice for uncertainty factors is based on little ecological evidence. In 2001, Heugens already argued for obtaining uncertainty factors that sufficiently protect natural systems without being overprotective. Van Straalen (2003) echoed this and in current research the question is still raised if enough understanding has been gained to make accurate laboratory-to-field extrapolations. It remains a challenge to predict toxicant-induced effects on species and even on communities while accounting for variable and suboptimal environmental conditions, even though these conditions are common aspects of natural ecosystems (see for instance the section on Eco-epidemiology).


References

Barmentlo, S.H., Vriend, L.M, van Grunsven, R.H.A., Vijver, M.G. (submitted). Evidence that neonicotinoids contribute to damselfly decline.

Crommentuijn, T., Doornekamp, A., Van Gestel, C.A.M. (1997). Bioavailability and ecological effects of cadmium on Folsomia candida (Willem) in an artificial soil substrate as influenced by pH and organic matter. Applied Soil Ecology 5, 261-271.

Heugens, E.H., Hendriks, A.J., Dekker, T., Van Straalen, N.M., Admiraal, W. (2001). A review of the effects of multiple stressors on aquatic organisms and analysis of uncertainty factors for use in risk assessment. Critical Reviews in Toxicology 31, 247-84.

Holmstrup, M., Bindesbøl, A.M., Oostingh, G.J., Duschl, A., Scheil, V., Köhler, H.R., Loureiro, S., Soares, A.M.V.M., Ferreira, A.L.G., Kienle, C., Gerhardt, A., Laskowski, R., Kramarz, P.E., Bayley, M., Svendsen, C., Spurgeon, D.J. (2010). Review Interactions between effects of environmental chemicals and natural stressors: A review. Science of the Total Environment 408, 3746–3762.

Van Straalen, N.M. (2003). Ecotoxicology becomes stress ecology Environmental Science and Technology 37, 324A-330A.

4.4.5. Chronic toxicity - Eco

Author: Michiel Kraak

Reviewers: Kees van Gestel and Lieven Bervoets


Learning objectives:

You should be able to

  • explain the concepts involved in chronic toxicity testing, including the Acute to Chronic Ratio (ACR).
  • design chronic toxicity experiments and to solve the challenges involved in chronic toxicity testing.
  • interpret the results of chronic toxicity experiments and to mention the types of effects of toxicants that cannot be determined in acute toxicity experiments.


Key words: Chronic toxicity, chronic sublethal endpoints, Acute to Chronic Ratio, mode of action.


Introduction

Most toxicity tests performed are short-term high-dose experiments, acute tests in which mortality is often the only endpoint. This is in sharp contrast with the field situation, where organisms are often exposed to relatively low levels of contaminants for their entire life span. The shorter the life cycle of the organism, the more realistic this scenario becomes. Hence, there is an urgent need for chronic toxicity testing. It should be realized though, that the terms acute and chronic have to be considered in relation to the length of the life cycle of the organism. A short-term exposure of four days is acute for fish, but chronic for algae, comprising already four generations.


From acute to chronic toxicity testing

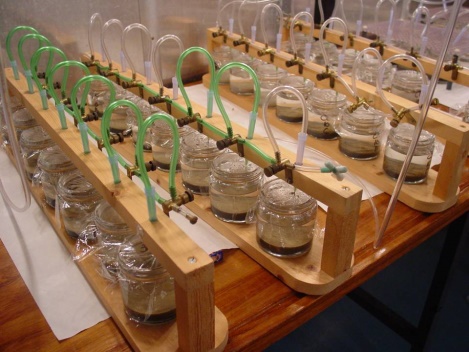
The reason for the bias towards acute toxicity testing is obviously the higher costs involved in chronic toxicity testing, simply caused by the much longer duration of the test. Yet, chronic toxicity testing is challenging for several other reasons as well. First of all, during prolonged exposure organisms have to be fed. Although unavoidable, especially in aquatic toxicity testing, this will definitely influence the partitioning and the bioavailability of the test compound. Especially lipophilic compounds will strongly bind to the food, making toxicant uptake via the food more important than for hydrophilic compounds, thus causing compound specific changes in exposure routes. For chronic aquatic toxicity tests, especially for sediment testing, it may be challenging to maintain sufficiently high oxygen concentrations throughout the entire experiment (Figure 1).


Figure 1. Experimental design of a chronic sediment toxicity experiment, showing the experimental units and the aeration system.


Obvious choices to be made include the duration of the exposure and the endpoints of the test. Generally it is aimed at including at least one reproductive event or the completion of an entire life cycle of the organism within the test duration. To ensure this, validity criteria are set to the different test guidelines, such as:

-       the mean number of living offspring produced per control parent daphnid surviving till the end of the test should be above 60 (OECD, 2012).

-       85% of the adult control chironomid midges from the control treatment should emerge between 12 and 23 days after the start of the experiment (OECD, 2010).

-       the mean number of juveniles produced by 10 control collembolans should be at least 100 (OECD, 2016a).


Chronic toxicity

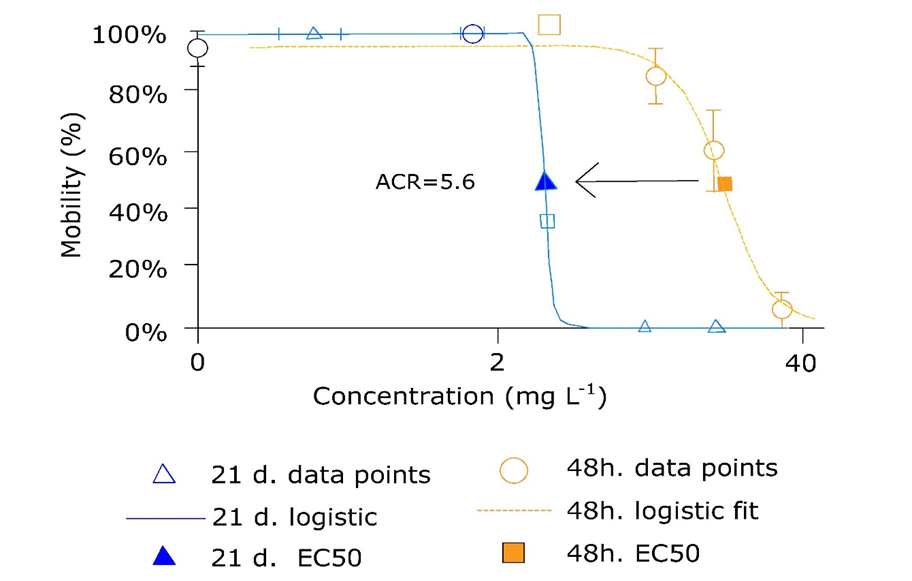
Generally toxicity increases with increasing exposure time, often expressed as the acute-to-chronic ratio (ACR), which is defined as the LC50 from an acute test divided by the door NOEC of EC10 from the chronic test. Alternatively, as shown in Figure 2, the acute LC50 can be divided by the chronic LC50. If compounds exhibit a strong direct lethal effect, the ACR will be low, but for compounds that slowly build up lethal body burdens (see section on Critical body concentrations) it can be very high. Hence, there is a relationship between the mode of action of a compound and the ACR. Yet, if chronic toxicity has to be extrapolated from acute toxicity data and the mode of action of the compound is unknown, an ACR of 10 is generally considered. It should be realized though that this number is chosen quite arbitrarily, potentially leading to under- as well as over estimation of the actual ACR.


Figure 2. Average mobility (% of initial animals) of Daphnia magna (n = 15) exposed to a concentration range of the flame retardant ALPI (mg L−1) in Elendt medium after 48 h (± s.e. in x and y, n = 4 × 5 individuals per concentration) and after 21 days (± s.e. in x, n = 15 individuals per concentration). The toxicity increases with increasing exposure time with an Acute Chronic Ratio (ACR) of 5.6. Redrawn from Waaijers at al. (2013) by Wilma IJzerman.


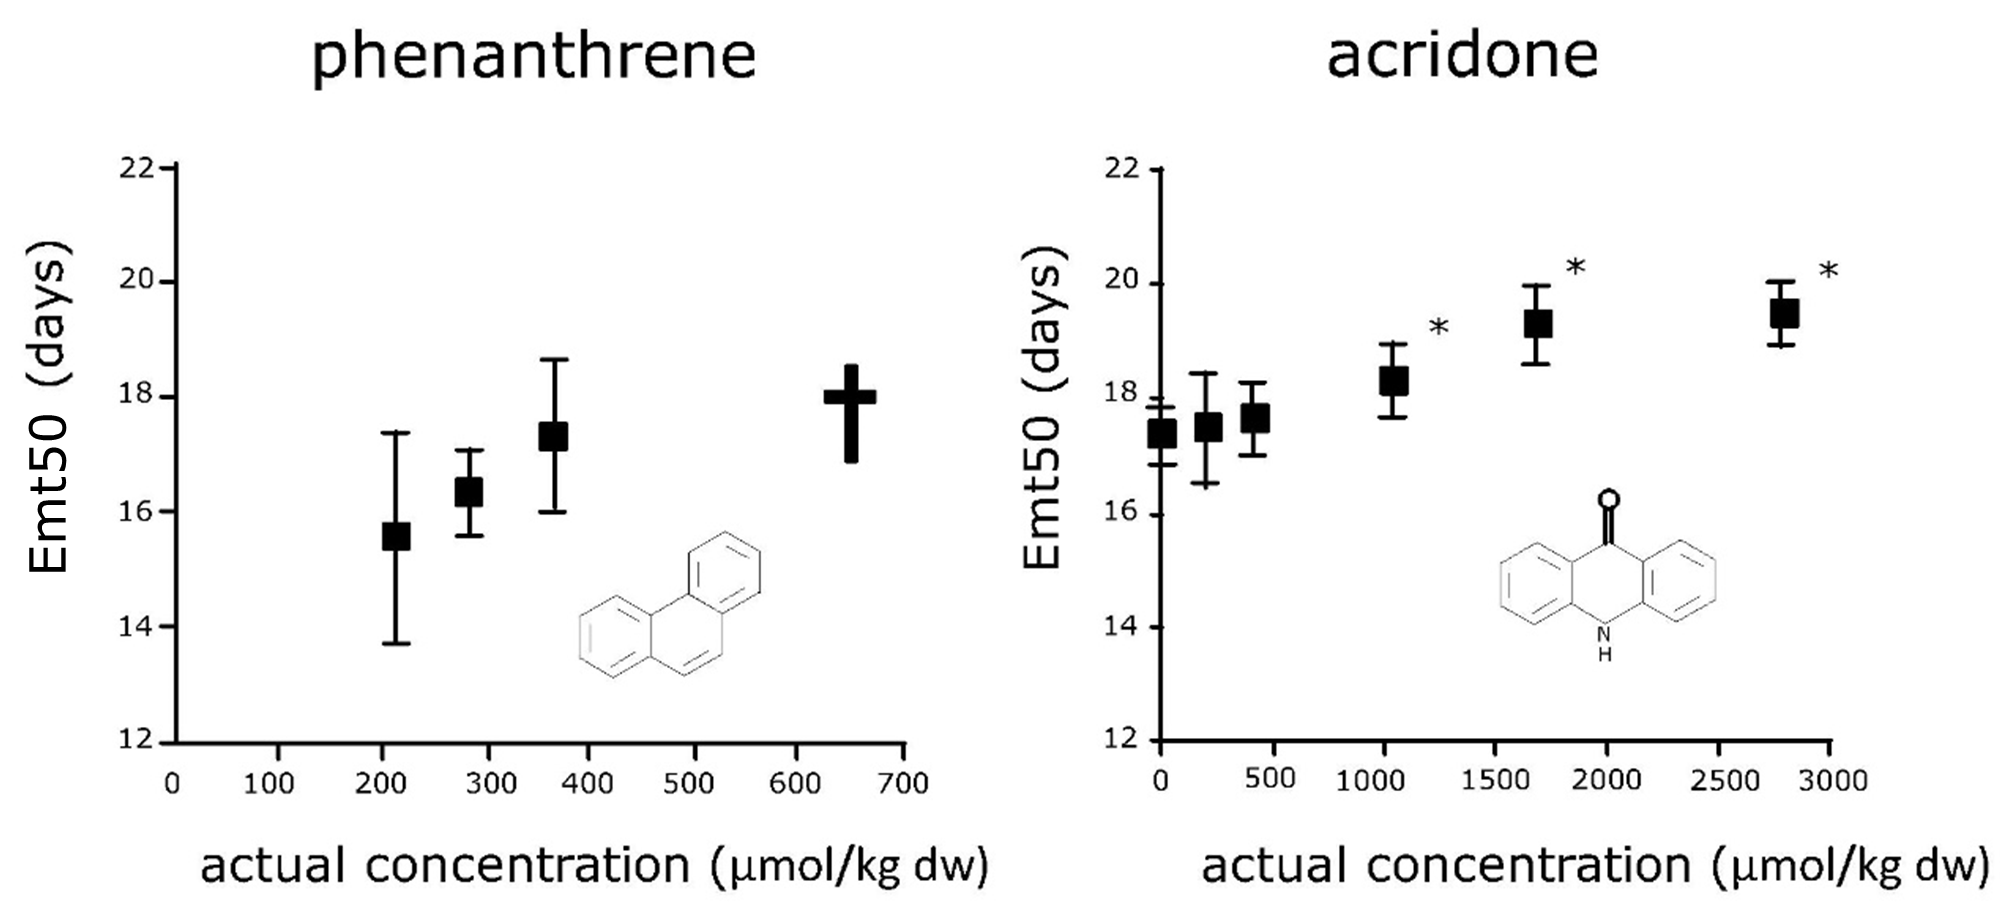
Since reproductive events and the completion of life cycles are involved, chronic toxicity tests allow an array of sublethal endpoints to be assessed, including growth and reproduction, as well as species specific endpoints like emergence (time) of chironomids. Consequently, compounds with different modes of action may cause very diverse sublethal effects on the test organisms during chronic exposure (Figure 3). The polycyclic aromatic compound (PAC) phenanthrene did not affect the completion of the life cycle of the midges, but above a certain exposure concentration the larvae died and no emergence was observed at all, suggesting a non-specific mode of action (narcosis). In contrast, the PAC acridone caused no mortality but delayed adult emergence significantly over a wide range of test concentrations, suggesting a specific mode of action affecting life cycle parameters of the midges (Leon Paumen et al., 2008). This clearly demonstrates that specific effects on life cycle parameters of compounds with different modes of action need time to become expressed.


Figure 3. Effect of two polycyclic aromatic compounds (PACs) on the emergence time of Chironomus riparius males from spiked sediments. X-axis: actual concentrations of the compounds measured in the sediment. Y-axis: 50% male emergence time (EMt50, days, average plus standard deviations). †Concentrations with no emerging midges. *EMt50 value significantly different from control value (p < 0.05). Redrawn from Leon Paumen et al. (2008) by Wilma IJzerman.


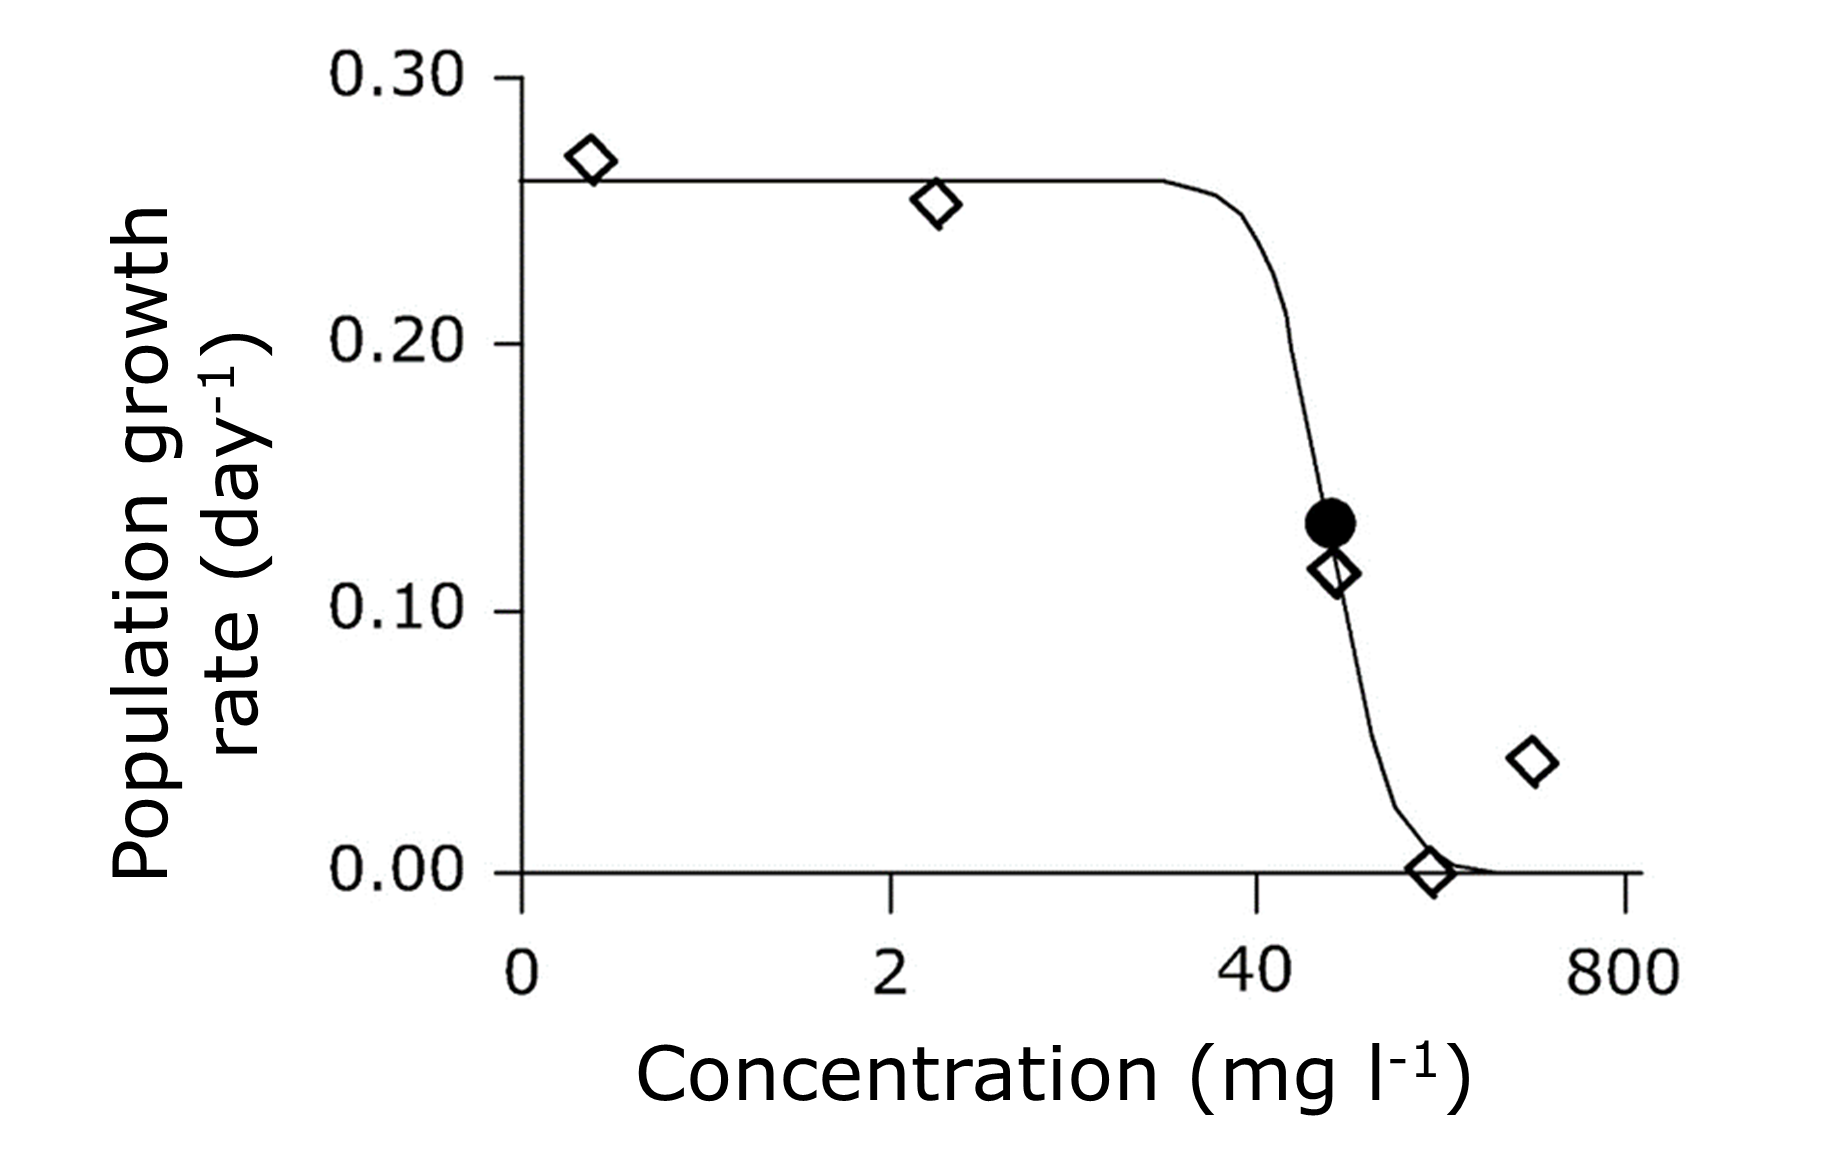
Chronic toxicity tests are single species tests, but if the effects of toxicants are assessed on all relevant life-cycle parameters, these can be integrated into effects on population growth rate (r). For the 21-day daphnid test this is achieved by the integration of age-specific data on the probability of survival and fecundity. The population growth rates calculated from chronic toxicity data are obviously not related to natural population growth rates in the field, but they do allow to construct dose-response relationships for the effects of toxicants on r, the ultimate endpoint in chronic toxicity testing (Figure 4; Waaijers et al., 2013).


Figure 4: Population growth rate (d−1) of Daphnia magna (n = 15) exposed to a concentration range of the flame retardant DOPO (mg L−1) in Elendt medium after 21 days. The average population growth rate rate (◊) is shown (s.e. in x and y are smaller than the data points and therefore omitted). The EC50 is plotted as ● (s.e. smaller than data point) and the logistic curve represents the fitted concentration−response relationship. Redrawn from Waaijers et al. (2013) by Wilma IJzerman.


Chronic toxicity testing in practice

Several protocols for standardized chronic toxicity tests are available, although less numerous than for acute toxicity testing. For water, the most common test is the 21 day Daphnia reproduction test (OECD, 2012), for sediment 28-day test guidelines are available for the midge Chironomus riparius (OECD, 2010) and for the worm Lumbriculus variegatus (OECD, 2007). For terrestrial soil, the springtail Folsomia candida (OECD, 2016a) and the earthworm Eisenia fetida (OECD, 2016b) are the most common test species, but also for enchytraeids a reproduction toxicity test guideline is available (OECD, 2016c). For a complete overview see (https://www.oecd-ilibrary.org/environment/oecd-guidelines-for-the-testing-of-chemicals-section-2-effects-on-biotic-systems_20745761/datedesc#collectionsort).


References

Leon Paumen, M., Borgman, E., Kraak, M.H.S., Van Gestel, C.A.M., Admiraal, W. (2008). Life cycle responses of the midge Chironomus riparius to polycyclic aromatic compound exposure. Environmental Pollution 152, 225-232.

OECD (2007). OECD Guideline for Testing of Chemicals. Test No. 225: Sediment-Water Lumbriculus Toxicity Test Using Spiked Sediment. Section 2: Effects on Biotic Systems; Organization for Economic Co-operation and Development: Paris, 2007.

OECD (2010). OECD Guideline for Testing of Chemicals. Test No. 233: Sediment-Water Chironomid Life-Cycle Toxicity Test Using Spiked Water or Spiked Sediment. Section 2: Effects on Biotic Systems; Organization for Economic Co-operation and Development: Paris, 2010.

OECD (2012). OECD Guideline for Testing of Chemicals. Test No. 211. Daphnia magna Reproduction Test No. 211. Section 2: Effects on Biotic Systems; Organization for Economic Co-operation and Development: Paris, 2012.

OECD (2016a). OECD Guideline for Testing of Chemicals. Test No. 232. Collembolan Reproduction Test in Soil. Section 2: Effects on Biotic Systems; Organization for Economic Co-operation and Development: Paris, 2016.

OECD (2016b). OECD Guideline for Testing of Chemicals. Test No. 222. Earthworm Reproduction Test (Eisenia fetida/Eisenia andrei). Section 2: Effects on Biotic Systems; Organization for Economic Co-operation and Development: Paris, 2016.

OECD (2016c). OECD Guideline for Testing of Chemicals. Test No. 220: Enchytraeid Reproduction Test. Section 2: Effects on Biotic Systems; Organization for Economic Co-operation and Development: Paris, 2016.

Waaijers, S.L., Bleyenberg, T.E., Dits, A., Schoorl, M., Schütt, J., Kools, S.A.E., De Voogt, P., Admiraal, W.,  Parsons,  J.R., Kraak, M.H.S. (2013). Daphnid life cycle responses to new generation flame retardants. Environmental Science and Technology 47, 13798-13803.

4.4.6. Multigeneration toxicity testing - Eco

Author: Michiel Kraak

Reviewers: Kees van Gestel, Miriam Leon Paumen


Learning objectives:

You should be able to

·         explain how effects of toxicants may propagate during multigeneration exposure.

·         describe the experimental challenges and limitations of multigeneration toxicity testing and to be able to design multigeneration tests.

·         explain the implications of multigeneration testing for ecological risk assessment.


Key words: Multigeneration exposure, extinction, adaptation, test design


Introduction

It is generally assumed that chronic life cycle toxicity tests are indicative of the actual risk that populations suffer from long-term exposure. Yet, at contaminated sites, organisms may be exposed during multiple generations and the shorter the life cycle of the organism, the more realistic this scenario becomes. There are, however, only few multigeneration studies performed, due to the obvious time and cost constraints. Since both aquatic and terrestrial life cycle toxicity tests generally last for 28 days (see section on Chronic toxicity), multigeneration testing will take approximately one month per generation. Moreover, the test compound often affects the life cycle of the test species in a dose-dependent manner. Consequently, the control population, for example, could already be in the 9th generation, while an exposed population could still be in the 8th generation due to chemical exposure related delay in growth and/or development. On top of these experimental challenges, multigeneration experiments are extremely error prone, simply because the chance that an experiment fails increases with increasing exposure time.


Experimental considerations

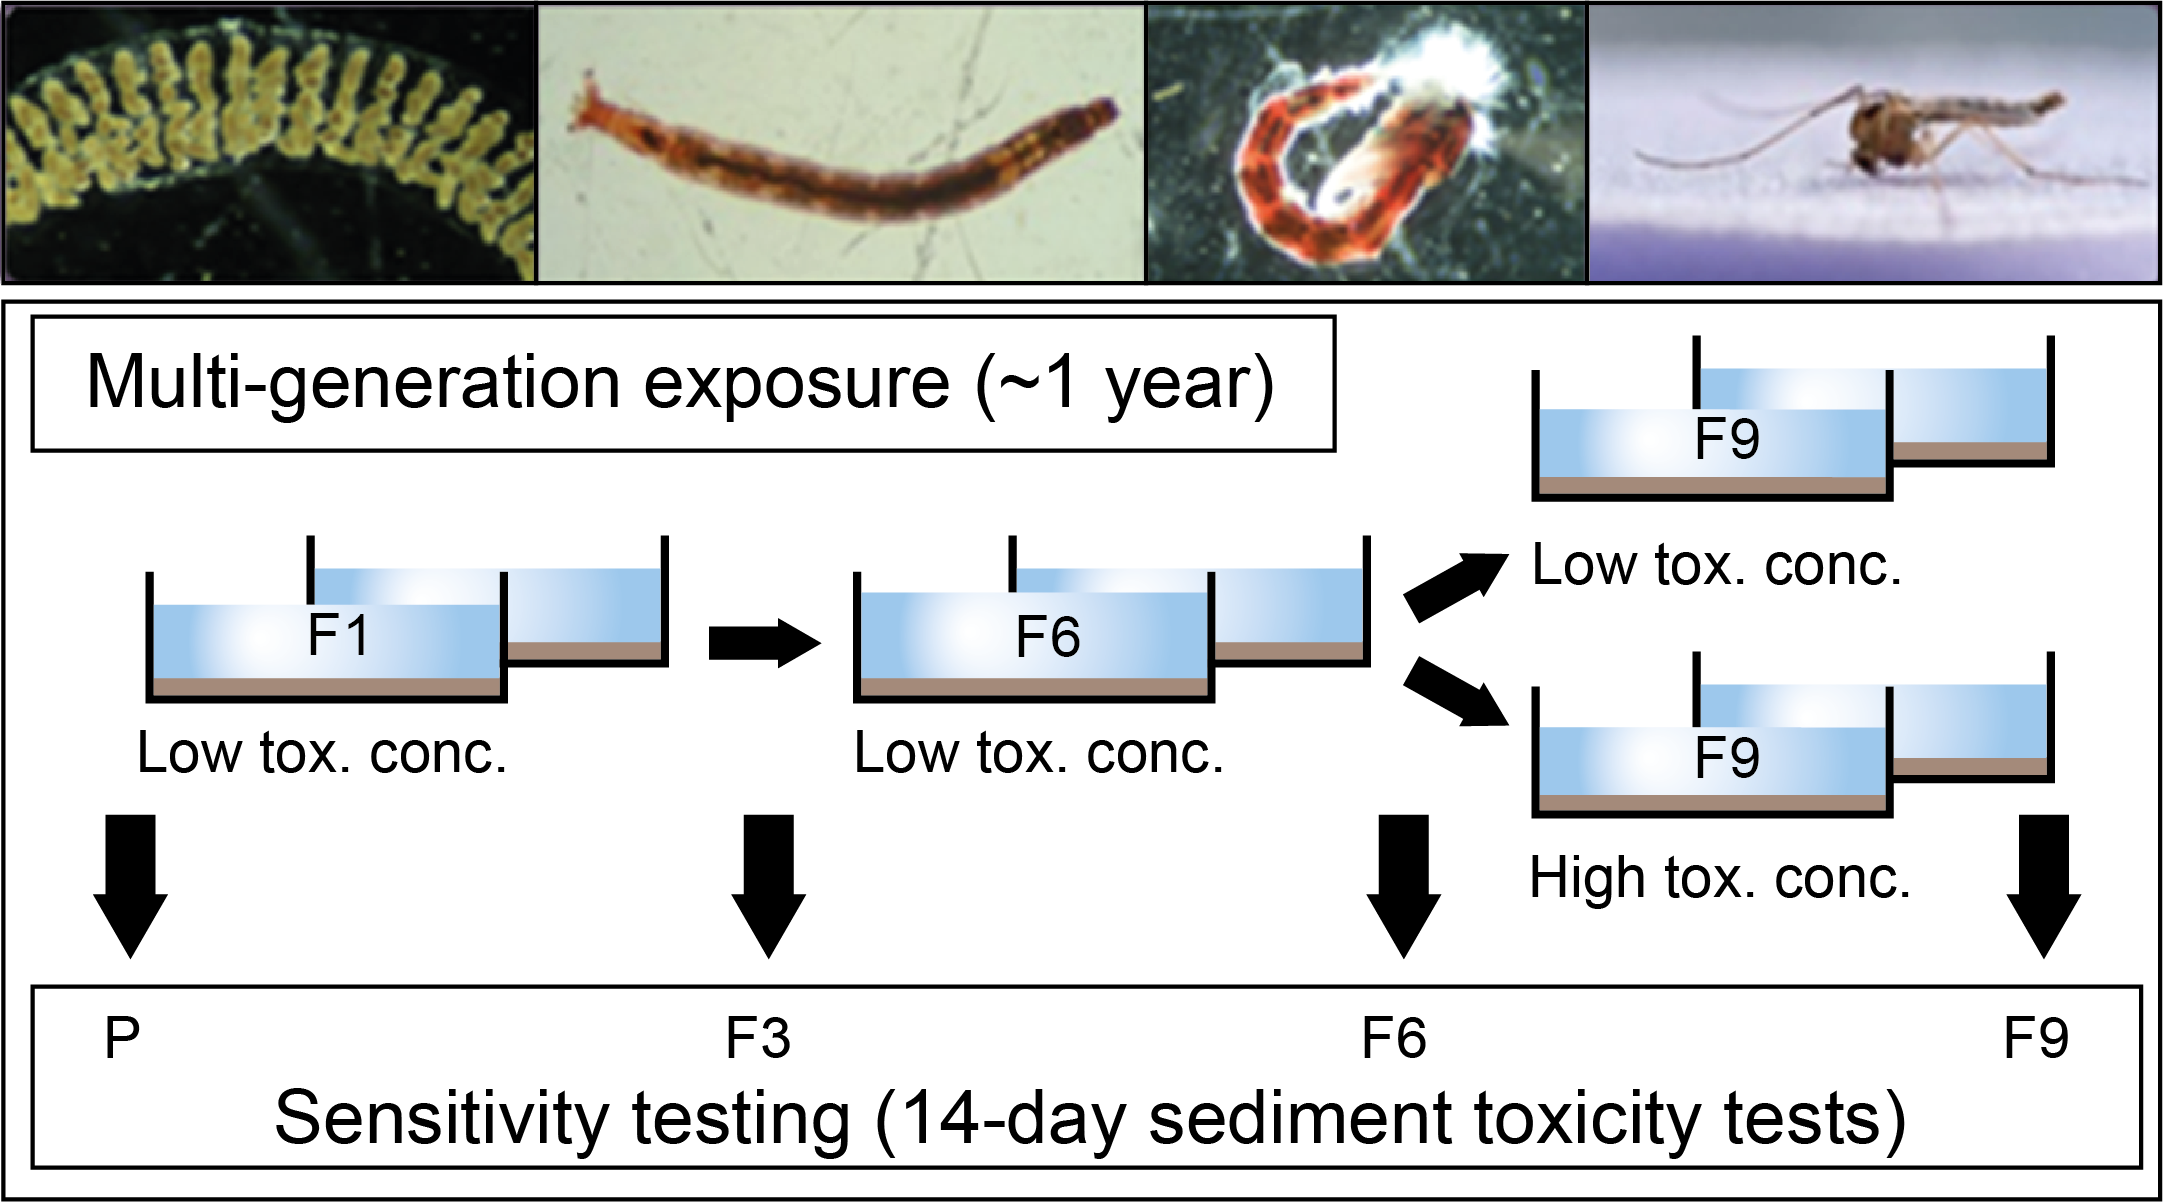
Designing a multigeneration toxicity experiment is challenging. First of all, there is the choice of how many generations the experiment should last, which is most frequently, but completely arbitrarily, set at approximately 10. Test concentrations have to be chosen as well, mostly based on chronic life cycle EC50 and EC10 values (Leon Paumen et al. 2008). Yet, it cannot be anticipated if, and to what extent, toxicity increases (or decreases) during multigeneration exposure. Hence, testing only one or two exposure concentrations increases the risk that the observed effects are not dose related, but are simply due to stochasticity. If the test concentrations chosen are too high, many treatments may go extinct after few generations. In contrast, too low test concentrations may show no effect at all. The latter was observed by Marinkovic at al. (2012), who had to increase the exposure concentrations during the experiment (see Figure 1). Finally, since a single experimental treatment often consists of an entire population, treatment replication is also challenging.


Figure 1. Experimental design of a multigeneration toxicity experiment with the non-biting midge Chironomus riparius. After six generations the exposure concentrations were increased due to lack of effect. To evaluate if multigeneration led to adaptation, after 3, 6 and 9 generations the sensitivity of the test organisms to the test compound was determined. Redrawn from Marinkovic et al. (2012) by Evelin Karsten-Meessen.


Once the experiment is running, choices have to be made on the transition from generation to generation. If a replicate is maintained in a single jar, vessel or aquarium, generations may overlap and exposure concentrations may decrease with time. Therefore, most often a new generation is started by exposing offspring from the previous exposed parental generation in a freshly spiked experimental unit.


If the aim is to determine how a population recovers when the concentration of the toxicant decreases with time, exposure to a single spiked medium also is an option, which seems most applicable to soils (Ernst et al., 2016; van Gestel et al., 2017). To assess recovery after several generations of (continuous) exposure to contaminated media, offspring from previous exposed generations may be maintained under control conditions.

A wide variety of endpoints can be selected in multigeneration experiments. In case of aquatic insects like the non-biting midge Chironomus riparius these include survival, larval development time, emergence, emergence time, adult life span and reproduction. For terrestrial invertebrates survival, growth and reproduction can be selected. Only a very limited number of studies evaluated actual population endpoints like population growth rate (Postma and Davids, 1995).


To persist or to perish

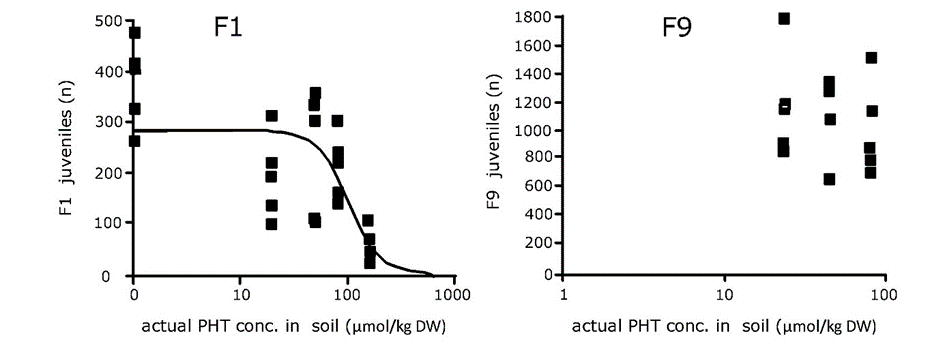
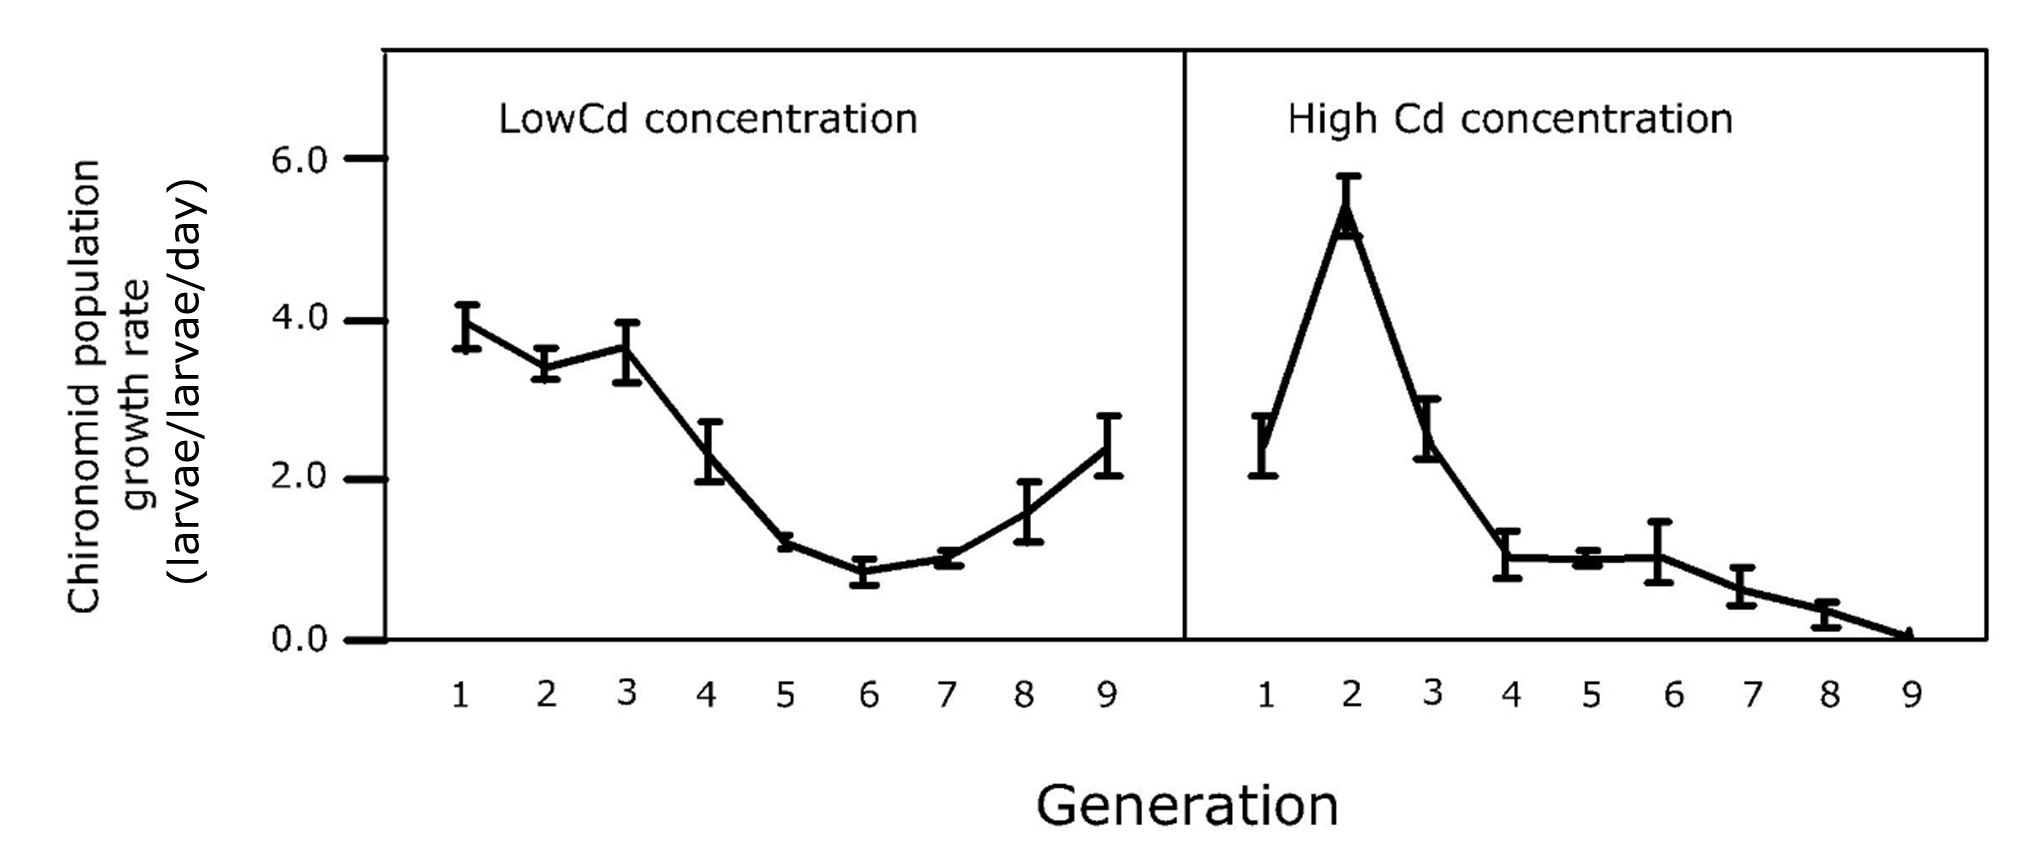
If organisms are exposed for multiple generations the effects tend to worsen, ultimately leading to extinction, first of the population exposed to the highest concentration, followed by populations exposed to lower concentrations in later generations (Leon Paumen et al. 2008). Yet, it cannot be excluded that extinction occurs due to the relatively small population sizes in multigeneration experiments, while larger populations may pass a bottleneck and recover during later generations.

Thresholds have also been reported, as shown in Figure 2 (Leon Paumen et al. 2008). Below certain exposure concentrations the exposed populations perform equally well as the controls, generation after generation. Hence, these concentrations may be considered as the ‘infinite no effect concentration’. A mechanistic explanation may be that the metabolic machinery of the organism is capable of detoxifying or excreting the toxicants and that this takes so little energy that there is no trade off regarding growth and reproduction.


Figure 2. Transition from dose-response relationships to threshold concentrations during a multigeneration toxicity experiment with the collembolan Folsomia candida. Redrawn from Leon Paumen et al. (2008) by Wilma IJzerman.


It is concluded that the frequently reported worsening of effects during multigeneration toxicant exposure raises concerns about the use of single-generation studies in risk assessment to tackle long-term population effects of environmental toxicants.


Figure 3. Extinction at a relatively high exposure concentration and adaptation at a relatively low exposure concentration during a multigeneration toxicity experiment with the non-biting midge Chironomus riparius. Redrawn from Postma & Davids (1995) by Wilma IJzerman.


If populations exposed for multiple generations do not get extinct and persist, they may have developed resistance or adaptation (Figure 3). Regular sensitivity testing can therefore be included in multigeneration experiments, as depicted in Figure 1. Yet, it is still under debate whether this lower sensitivity is due to genetic adaptation, epigenetics or phenotypic plasticity (Marinkovic et al., 2012).


References

Ernst, G., Kabouw, P., Barth, M., Marx, M.T., Frommholz, U., Royer, S., Friedrich, S. (2016). Assessing the potential for intrinsic recovery in a Collembola two-generation study: possible implementation in a tiered soil risk assessment approach for plant protection products. Ecotoxicology 25, 1–14.

Leon Paumen, M., Steenbergen, E.,  Kraak,  M.H.S., Van Straalen, N. M., Van Gestel, C.A.M. (2008). Multigeneration exposure of the springtail Folsomia candida to phenanthrene: from dose-response relationships to threshold concentrations. Environmental Science and Technology 42, 6985-6990.

Marinkovic, M., De Bruijn, K., Asselman, M., Bogaert, M., Jonker, M.J., Kraak, M.H.S., Admiraal, W. (2012). Response of the nonbiting midge Chironomus riparius to multigeneration toxicant exposure. Environmental Science and Technology 46, 12105−12111.

Postma. J.F., Davids, C. (1995). Tolerance induction and life-cycle changes in cadmium-exposed Chironomus riparius (Diptera) during consecutive generations. Ecotoxicology and Environmental Safety 30, 195-202.

Van Gestel, C.A.M., De Lima e Silva, C., Lam, T., Koekkoek, J.C. Lamoree, M.H., Verwei, R.A. (2017). Multigeneration toxicity of imidacloprid and thiacloprid to Folsomia candida. Ecotoxicology 26, 320–328.


4.4.7. Tropical Ecotoxicology

Authors: Michiel Daam, Jörg Römbke

Reviewer: Kees van Gestel, Michiel Kraak


Learning objectives:

You should be able

·         to name the distinctive features of tropical and temperate ecosystems

·         to explain their implications for environmental risk assessment in these regions

·         to mention some of the main research needs in tropical ecotoxicology


Key words: Environmental risk assessment; pesticides; temperature; contaminant fate; test methods


Introduction

The tropics cover the area of the world (approx. 40%) that lies between the Tropic of Cancer, 23½° north of the equator and the Tropic of Capricorn, 23½° south of the equator. It is characterized by, on average, higher temperatures and sunlight levels than in temperate regions. Based on precipitation patterns, three main tropical climates may be distinguished: Tropical rainforest, monsoon and savanna climates. Due to the intrinsic differences between tropical and temperate regions, differences in the risks of chemicals are also likely to occur. These differences are briefly exemplified by taking pesticides as an example, addressing the following subjects: 1) Climate-related factors; 2) Species sensitivities; 3) Testing methods; 4) Agricultural practices and legislation.


1.   Climate-related factors

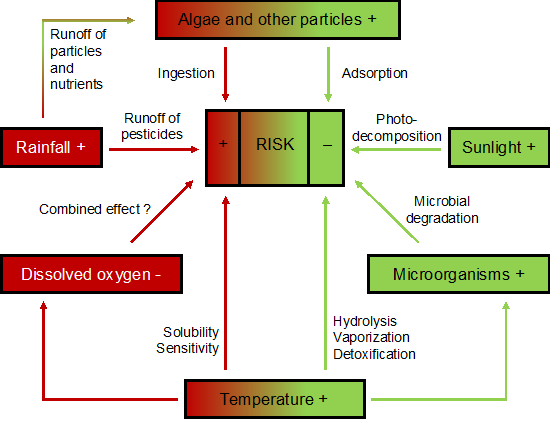
Three basic climate factors are essential for pesticide risks when comparing temperate and tropical aquatic agroecosystems: rainfall, temperature and sunlight. For example, high tropical temperatures have been associated with higher microbial activities and hence enhanced microbial pesticide degradation, resulting in lower exposure levels. On the other hand, toxicity of pesticides to aquatic biota may be higher with increasing temperature. Regarding terrestrial ecosystems, other important abiotic factors to be considered are soil humidity, pH, clay and organic carbon content and ion exchange capacity (i.e. the capacity of a soil to adsorb certain compounds) (Daam et al., 2019). Although several differences in climatic factors may be distinguished between tropical and temperate areas, these do not lead to consistent greater or lesser pesticide risk (e.g. Figure 1).


Figure 1. Schematic overview of the climatic related factors that have a possible influence on the risks of pesticides to aquatic ecosystems. The “+” and “-“ in the parameter textboxes indicate relatively higher and lower levels of these parameters in tropical compared to temperate regions, respectively. Similarly, the “+” and “-“ in the textbox “RISK” indicate a higher and lower risk in tropical compared to temperate freshwaters, respectively. Adapted from Daam and Van den Brink (2010).


2. Species sensitivities

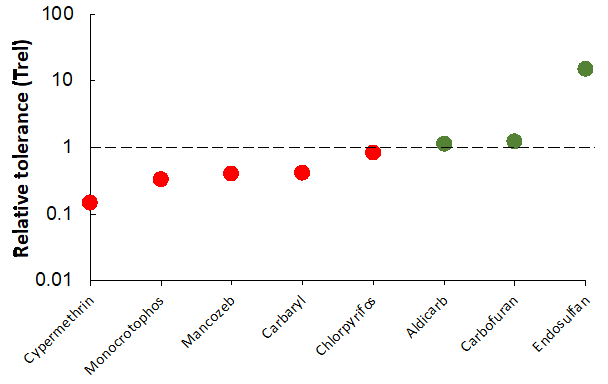
Tropical areas harbour the highest biodiversity in the world and generate nearly 60% of the primary production. This higher species richness, as compared to their temperate counterparts, dictates that the possible occurrence of more sensitive species cannot be ignored. However, studies comparing the sensitivity of species from the same taxonomic group did not demonstrate a consistent higher or lower sensitivity of tropical organisms compared to temperate organisms (e.g. Figure 2).


Figure 2. Comparison of the pesticide sensitivity of the tropical earthworm Perionyx excavatus with that of Eisenia fetida sensu lato using the relative tolerance (Trel) approach. The vertical dashed line at Trel = 1 indicates the sensitivity of E. fetida sensu lato. A Trel < 1 (red dots) and Trel > 1 (green dots) indicate a higher and lower sensitivity of P. excavatus relative to E. fetida sensu lato, respectively. PAF = potentially affected fraction. Modified from Daam et al. (2019).


3) Testing methods

Given the vast differences in environmental conditions between tropical and temperate regions, the use of test procedures developed under temperate environments to assess pesticide risks in tropical areas has often been disputed. Subsequently, methods developed under temperate conditions need to be adapted to tropical environmental conditions, e.g. by using tropical test substrates and by testing at higher temperatures (Niva et al., 2016). As discussed above, tropical and temperate species from the same taxonomic group are not expected to demonstrate consistent differences in sensitivity. However, certain taxonomic groups may be more represented and/or ecologically or economically more important in tropical areas, such as freshwater shrimps (Daam and Rico, 2016) and (terrestrial) termites (Daam et al., 2019). Subsequently, the development of test procedures for such species and the incorporation in risk assessment procedures seems imperative.


4) Agricultural practices and legislation

Agricultural practices in tropical countries are likely to lead to a higher pesticide exposure and hence higher risks to aquatic and terrestrial ecosystems under tropical conditions. Some of the main reasons for this include i) unnecessary applications and overuse; ii) use of cheaper but more hazardous pesticides, and iii) dangerous transportation and storage conditions, all often a result of a lack in training of pesticide applicators in the tropics (Daam and Van den Brink, 2010; Daam et al., 2019). Finally, countries in tropical regions usually do not have strict laws and risk assessment regulations in place regarding the registration and use of pesticides, meaning that pesticides banned in temperate regions for environmental reasons are often regularly available and used in tropical countries such as Brazil (e.g. Waichman et al. 2002).


References and recommended further reading

Daam, M.A., Van den Brink, P.J. (2010). Implications of differences between temperate and tropical freshwater ecosystems for the ecological risk assessment of pesticides. Ecotoxicology 19, 24–37.

Daam, M.A., Chelinho, S., Niemeyer, J., Owojori, O., de Silva, M., Sousa, J.P., van Gestel, C.A.M., Römbke, J. (2019). Environmental risk assessment of pesticides in tropical terrestrial ecosystems: current status and future perspectives. Ecotoxicology and Environmental Safety 181, 534-547.

Daam, M.A., Rico, A. (2016). Freshwater shrimps as sensitive test species for the risk assessment of pesticides in the tropics. Environmental Science and Pollution Research 25, 13235–13243.

Niemeyer, J.C., Moreira-Santos, M., Nogueira, M.A., Carvalho, G.M., Ribeiro, R., Da Silva, E.M., Sousa, J.P. (2010). Environmental risk assessment of a metal contaminated area in the Tropics. Tier I: screening phase. Journal of Soils and Sediments 10, 1557–1571.

Niva, C.C., Niemeyer, J.C., Rodrigues da Silva Júnior, F.M., Tenório Nunes, M.E., de Sousa, D.L., Silva Aragão, C.W., Sautter, K.D., Gaeta Espindola, E., Sousa, J.P., Römbke, J. (2016). Soil Ecotoxicology in Brazil is taking its course. Environmental Science and Pollution Research 23, 363-378.

Waichman, A.V., Römbke, J., Ribeiro, M.O.A., Nina, N.C.S. (2002). Use and fate of pesticides in the Amazon State, Brazil. Risk to human health and the environment. Environmental Science and Pollution Research 9, 423-428.

  • Het arrangement 4.4. Increasing ecological realism in toxicity testing is gemaakt met Wikiwijs van Kennisnet. Wikiwijs is hét onderwijsplatform waar je leermiddelen zoekt, maakt en deelt.

    Laatst gewijzigd
    2021-09-01 11:26:20
    Licentie

    Dit lesmateriaal is gepubliceerd onder de Creative Commons Naamsvermelding 4.0 Internationale licentie. Dit houdt in dat je onder de voorwaarde van naamsvermelding vrij bent om:

    • het werk te delen - te kopiëren, te verspreiden en door te geven via elk medium of bestandsformaat
    • het werk te bewerken - te remixen, te veranderen en afgeleide werken te maken
    • voor alle doeleinden, inclusief commerciële doeleinden.

    Meer informatie over de CC Naamsvermelding 4.0 Internationale licentie.

    Aanvullende informatie over dit lesmateriaal

    Van dit lesmateriaal is de volgende aanvullende informatie beschikbaar:

    Eindgebruiker
    leerling/student
    Moeilijkheidsgraad
    gemiddeld
    Studiebelasting
    4 uur en 0 minuten

    Gebruikte Wikiwijs Arrangementen

    Toxicologie tekstboek SURF. (z.d.).

    4. Toxicology

    https://maken.wikiwijs.nl/120176/4__Toxicology