5. Population, Community and Ecosystem Ecotoxicology

5. Population, Community and Ecosystem Ecotoxicology

5.1. Introduction: Linking population, community and ecosystem responses

In preparation

5.2. Population ecotoxicology in laboratory settings

Author: Michiel Kraak

Reviewers: Nico van den Brink and Matthias Liess


Learning objectives:

You should be able to

·         motivate the importance of studying ecotoxicology at the population level.

·         name the properties of populations, unique to this level of biological organisation.

·      explain the implications of age and developmental stage specific sensitivities for population responses to toxicant exposure.


Key words: Population ecotoxicology, density, age structure, population growth rate


Introduction

The motivation to study ecotoxicological effects at the population level is that generally the targets of environmental protection are indeed populations, communities and ecosystems. Additionally, several phenomena are unique to this level, including age specific sensitivity and interaction between individuals. Studying the population level is distinguished from the individual level and lower by a less direct link between the chemical exposure and the observed effects, due to individual variability and several feedback loops, loosening the dose-response relationships. Research at the population level is thus characterized by an increasing level of uncertainty if these processes are not properly addressed and by increasing time and efforts. Hence, it is not surprising that effects at the population are understudied. This is even more the case for investigations on higher levels like meta-populations, communities and ecosystems (see sections on meta-populations, communities and ecosystems). It is thus highly important to obtain data and insights into mechanisms leading to effects at the population level, keeping in mind the relevant interactions with lower and higher levels of organisation.

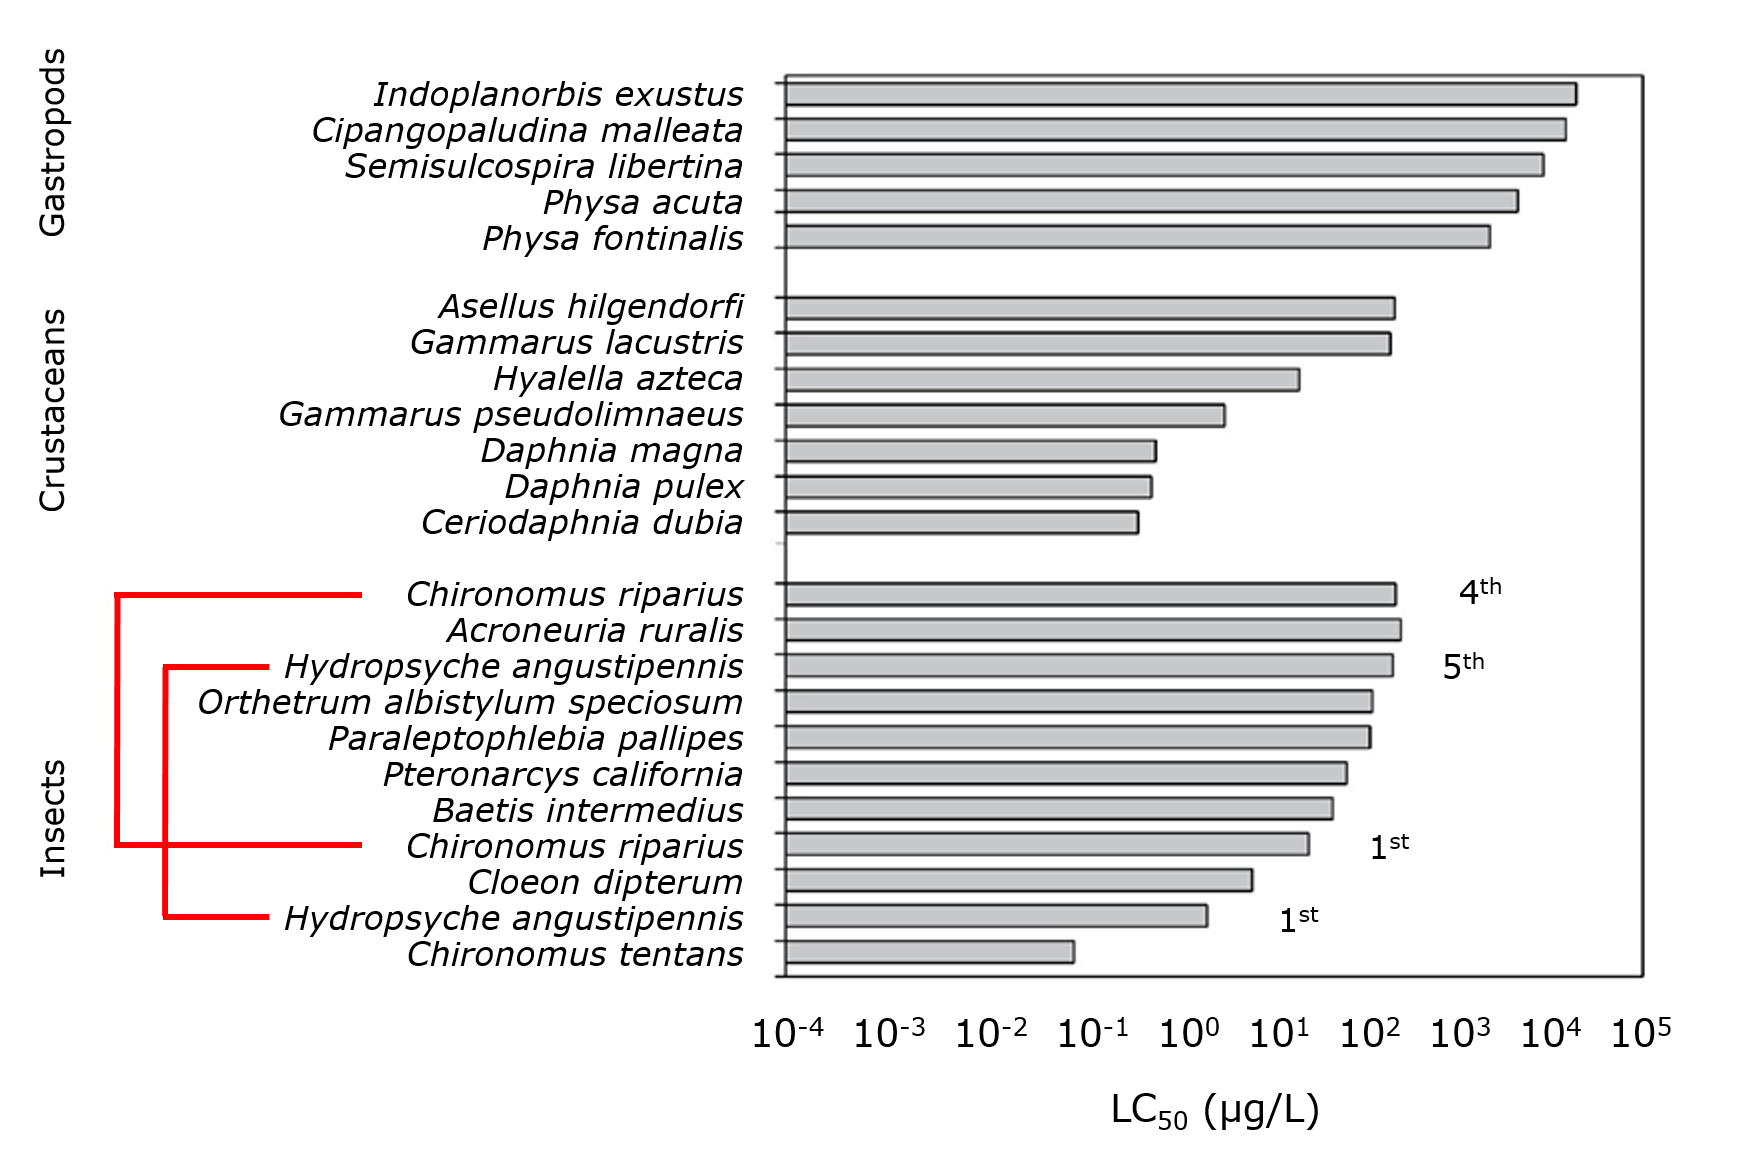
Properties of populations are unique to this level of biological organization and include social structure (see section on invertebrate community ecotoxicology), genetic composition (see section on genetic variation), density and age structure. This gives room to age and developmental stage specific sensitivities to chemicals. For almost all species, young individuals like neonates or first instars are markedly more sensitive than adults or late instar larvae. This difference may run up to three orders of magnitude and consequently instar specific sensitivities may vary as much as species specific sensitivities (Figure 1). Population developmental stage specific sensitivities have also been reported. Exponentially growing daphnid populations exposed to the insecticide fenvalerate recovered much faster than populations that reached carrying capacity (Pieters and Liess, 2006). Given the age and developmental stage specific sensitivities, the timing of exposure to toxicants in relation to the critical life stage of the organism may seriously affect the extent of the adverse effects, especially in seasonally synchronised populations.


Figure 1. 48h LC50 values of the insecticide diazinon for insects, crustaceans, and gastropods ranked according to sensitivity (according to Stuijfzand et al., 2000), showing that instar specific sensitivities may vary as much as species specific sensitivities. Drawn by Wilma IJzerman.


A challenging question involved in population ecotoxicology is when a population is considered to be stable or in steady state. In spite of the various types of oscillation all populations depicted in Figure 2 can be considered to be stable. One could even argue that any population that does not go extinct can be considered stable. Hence, a single population could vary considerable in density over time, potentially strongly affecting the impact of exposure to toxicants.


Figure 2. Different types of population development over time. Drawn by Wilma IJzerman.


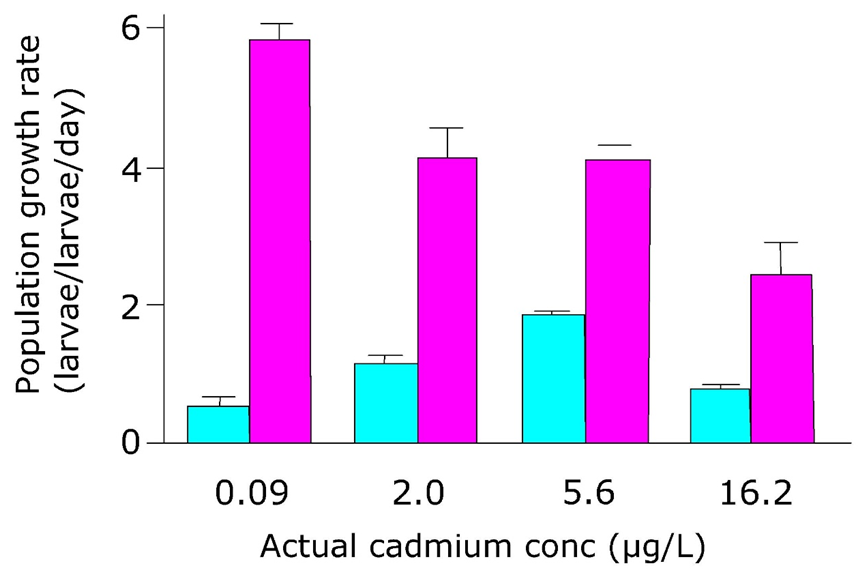
When populations suffer from starvation and crowding due to high densities and intraspecific competition, they are markedly more sensitive to toxicants, sometimes even up to a factor of 100 (Liess et al., 2016). This may even lead to unforeseen, indirect effects. Relative population growth rate (individual/individual/day) of high density populations of chironomids actually increased upon exposure to Cd, because Cd induced mortality diminished the food shortage for the surviving larvae (Figure 3). Only at the highest Cd exposure population growth rate decreased again. For populations at low densities, the anticipated decrease in population growth rate with increasing Cd concentrations was observed. Yet, at all Cd exposure levels growth rate of low density populations was markedly higher than that of high density populations.


Figure 3. Effects of cadmium exposure and density on population growth rate of Chironomus riparius (according to Postma et al., 1994). Mean values with standard error. Blue bars represent the high larval density and purple bars the low larval density. Redrawn by Wilma IJzerman.


Population ecotoxicity tests

In chronic ecotoxicity studies, preferably cohorts of individuals of the same size and age are selected to minimize variation in the outcome of the test, whereas in population ecotoxicology the natural heterogenous population composition is taken into account. This does make it harder though to interpret the obtained experimental data. Especially when studying populations of higher organisms in the wild, the increasing time to complete the research due to the long life span of these organisms imposes practical limitations (see section on wildlife population ecotoxicology). In the laboratory, this can be circumvented by selecting test species with relatively short life cycles, like algae, bacteria and zooplankton. For algae, a three or four day test can be considered as a multigeneration experiment and during 21 d female daphnids may release up to three clutches of neonates. These population ecotoxicity tests offer the unique possibility to calculate the ultimate population parameter, the population growth rate (r). This is a demographic population parameter, integrating survival, maturity time and reproduction (see section on population modeling). Yet, such chronic experiments are typically performed with cohorts and not with natural populations, making these experiments rather an extension of chronic toxicity tests than true population ecotoxicity tests.


References

Knillmann, S., Stampfli, N.C., Beketov, M.A., Liess, M. (2012). Intraspecific competition increases toxicant effects in outdoor microcosms. Ecotoxicology 21, 1857–1866.

Liess, M., Foit, K., Knillmann, S., Schäfer, R.B., Liess, H.-D. (2016). Predicting the synergy of multiple stress effects. Scientific Reports 6, 32965.

Pieters, B.J., Liess, M. (2006). Population developmental stage determines the recovery potential of Daphnia magna populations after fenvalerate application. Environmental Science and Technology 40, 6157-6162.


5.3. Wildlife population ecotoxicology

5.3.1. Forensic investigation into crash of Asian vulture populations

Author: Nico van den Brink

Reviewers: Ansje Löhr, John Elliott


Learning objectives:

You should be able to

  • describe how forensic approaches are used in ecotoxicology
  • critically reflect on the uncertainty of prospective risk assessment of new chemicals


Keywords: Pharmaceuticals, uncertainty, population decline, retrospective monitoring


Introduction

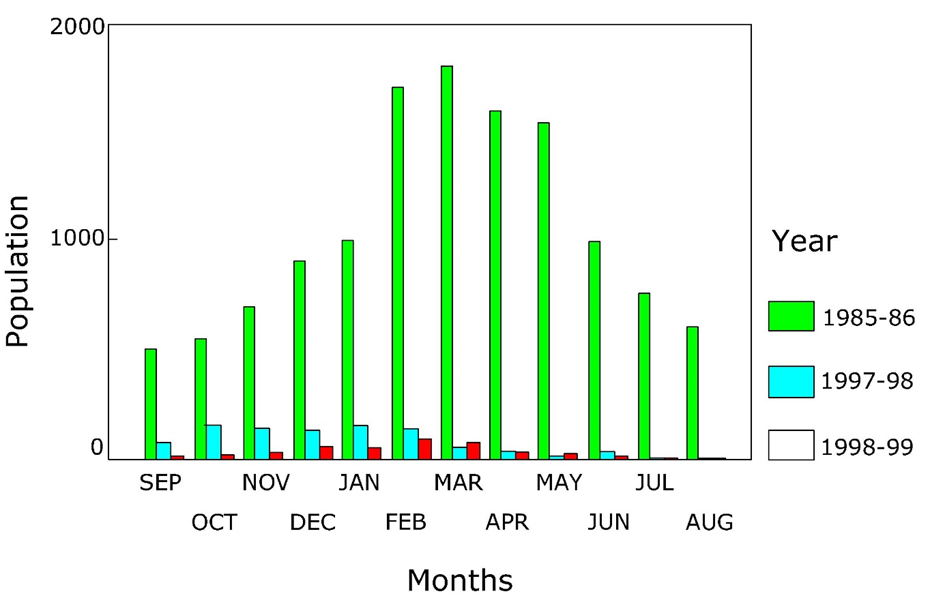
Historically, vulture populations in India, Pakistan and Nepal were too numerous to be effectively counted. In the mid-1990s numbers in northern India started to decline catastrophically, which was evidenced in the Keoladeo National Park (figure 1, Prakash 1999). Further monitoring of population numbers indicated unprecedented declines of over 90-99% from the mid-1990s to the early 2000s for Oriental White-backed vultures (Gyps bengalensis), Long-billed vultures (Gyps indicus) and also Slender-billed vultures (Gyps tenuirostris) (Prakash 1999).


Figure 1. Populations of White-backed vultures in Keoladeo National park in different years. Redrawn from Prakash (1999) by Wilma IJzerman.


In the following years, similar declines were observed in Pakistan and Nepal, indicating that the causative factor was not restricted to a specific country or area. Total losses of vultures were estimated to be in the order of tens of millions. The first ideas about potential causes of those declines focussed on known infectious diseases or the possibility of new diseases to which the vulture population had not been previously exposed. However, no diseases were identified that had shown similar rates of mortalities in other bird species. Vultures are also considered to have a highly developed immune response given their diet of scavenging dead and often decaying animals. To obtain insights, initial interdisciplinary ecological studies were performed to provide a basic understanding of background mortality in the species affected. These studies started in large colonies in Pakistan, but were literally races against time, as some populations had already decreased by 50%, while others were already extirpated, (Gilbert et al., 2006). Despite those difficulties it was determined that mortalities were occurring principally in adult birds and not at the nestling phase. More in depth studies were performed to discriminate between natural mortality of for instance juvenile fledglings, which may be high in summer, just after fledging. After scrutinising the data no seasonality was observed in the abnormal, high mortality, indicating that this was not related to breeding activities. The investigations also revealed another important factor that these vultures were predominantly feeding on domestic livestock, while telemetric observations, using transmitters to assess flight and activity patterns f the birds, showed that the individual birds could range over very long distances to reach carcasses of livestock (up to over 100 km).

Since no apparent causes for mortality were obtained in the ecological studies, more diagnostic investigations were started, focussing on infectious diseases and carried out in Pakistan (Oaks, 2011). However, that was easier said than done. Since large numbers of birds died, it was deemed essential to establish the logistics necessary to perform the diagnostics, including post-mortems, on all birds found dead. Although high numbers of birds died, hardly any fresh carcasses were available, due to remoteness of some areas, the presence of other scavengers and often hot conditions which fostered rapid decay of carcasses. Post-mortems on a selection off birds revealed that birds suspect of abnormal mortality all suffered from visceral gout, which is a white pasty smear covering tissues in the body including liver and heart. In birds, this is indicative for kidney failure. Birds metabolise nitrogen into uric acid (mammals into urea) which is normally excreted with the faeces. However, in case of kidney failure the uric acid is not excreted but deposited in the body. Further inspections of more birds confirmed this, and the working hypothesis became that the increased mortality was caused by a factor inducing kidney failure in the birds.

Based on the establishment of kidney failure as the causative factor, histological and pathological studies were performed on several birds found dead which revealed that in birds with visceral gout, kidney lesions were severe with acute renal tubular necrosis (Oaks et al., 2004), confirming the kidney failure hypothesis. However, no indications of inflammatory cell infiltrations were apparent, ruling out the possibilities of infectious diseases. Those observation shifted the focus to potential toxic effects, although no previous case was known with a chemical causing such severe and extremely acute effects. First the usual suspects for kidney failure were addressed, like trace metals (cadmium, lead) but also other acute toxic chemicals like organophosphorus and carbamate pesticides and organochlorine chemicals None of those chemicals occurred at levels of concern and were ruled out. That left the researchers without leads to any clear causative factor, even after years of study!

Some essential pieces of information were available, however:

1) acute renal failure seemed associated with the mortality,

2) no infectious agent was likely to be causative pointing to chemical toxicity,

3) since exposure was likely to be via the diet the chemical exposure needed to be related to livestock (the predominant diet for the vultures), pointing to compounds present in livestock such as veterinarian products,

4) widespread use of veterinarian chemicals had started relatively recently.

After a survey of veterinarians in the affected areas of Pakistan, a single veterinarian pharmaceutical matched the criteria, diclofenac. This is a non-steroid anti-inflammatory drug (NSAID) since long used in human medicine but only introduced since the 1990s as a veterinarian pharmaceutical in India, Pakistan and surrounding countries. NSAIDs are known nephrotoxic compounds, although no cases were known with such acute and sever impacts. Chemical analyses of kidneys of vultures confirmed that kidneys of birds with visceral gout contained diclofenac, birds without signs of visceral gout did not. Also kidneys from birds that showed visceral gout and that died in captivity while being studied, were positive for diclofenac, as was the meat they were fed with. This all indicated diclofenac toxicity as the cause of the mortality, which was validated in exposure studies, dosing captive vultures with diclofenac. The species of Gyps vultures appeared extremely sensitive to diclofenac, showing toxic effects at 1% of the therapeutic dose for livestock mammalian species.

This underlying mechanism for that sensitivity has yet to be explained, but initially it was also unclear why the populations were impacted to such severe extent. That was found to be related to the feeding ecology of the vultures. They were shown to fly long ranges to search for carcasses, and as a result of that they show very aggregated feeding, i.e. a lot of birds on a single carcass (Green et al., 2004). Hence, a single contaminated carcass may expose an unexpected large part of the population to diclofenac. Hence, a combination of extreme sensitivity, foraging ecology and human chemical use caused the onset of extreme population declines of some Asian vulture species of the Gyps genus, or so called “Old World vultures”.

This case demonstrated the challenges involved in attempting to disentangle the stressors causing very apparent population effects even on imperative species like vultures. It took several years of different groups of excellent researcher to perform the necessary research and forensic studies (under sometimes difficult conditions). Lessons learned are that even for compounds that have been used for a long time and thought to be well understood, unexpected effects may become evident. There is consensus that such effects may not be covered in current risk assessments of chemicals prior to their use and application, but this also draws attention to the need for continued post-market monitoring of organisms for potential exposure and effects. It should be noted that even nowadays, although the use of diclofenac is prohibited in larger parts of Asia, continued use still occurs due to its effectiveness in treating livestock and its low costs making it available to the farmers. Nevertheless, populations of Gyps vultures have shown to recover slowly.


References

Green, R.E., Newton, I.A., Shultz, S., Cunningham, A.A., Gilbert, M., Pain, D.J., Prakash, V. (2004). Diclofenac poisoning as a cause of vulture population declines across the Indian subcontinent. Journal of Applied Ecology 41, 793-800.

Gilbert, M., Watson, R.T., Virani, M.Z., Oaks, J.L., Ahmed, S., Chaudhry, M.J.I., Arshad, M., Mahmood, S., Ali, A., Khan, A.A. (2006). Rapid population declines and mortality clusters in three Oriental whitebacked vulture Gyps bengalensis colonies in Pakistan due to diclofenac poisoning. Oryx 40, 388-399.

Oaks, J.L., Gilbert, M., Virani, M.Z., Watson, R.T., Meteyer, C.U., Rideout, B.A., Shivaprasad, H.L., Ahmed, S., Chaudhry, M.J.I., Arshad, M., Mahmood, S., Ali, A., Khan, A.A. (2004). Diclofenac residues as the cause of vulture population decline in Pakistan. Nature 427, 630-633.

Oaks, J.L., Watson, R.T. (2011). South Asian vultures in crisis: Environmental contamination with a pharmaceutical. In: Elliott, J.E., Bishop, C.A., Morrissey, C.A. (Eds.) Wildlife Ecotoxicology. Springer, New York, NY. pp. 413-441.

Prakash, V. (1999). Status of vultures in Keoladeo National Park, Bharatpur, Rajasthan, with special reference to population crash in Gyps species. Journal of the Bombay Natural History Society 96, 365–378.


5.3.2. Otters, to PCB or not to PCB?

Author: Nico van den Brink

Reviewers: Ansje Löhr, Michiel Kraak, Pim Leonards, John Elliott


Learning objectives

You should be able to:

  • explain the derivation of toxic threshold levels by extrapolating between species
  • critically analyse implications of risk assessment for the conservation of species


Keywords: Threshold levels, read across, species specific sensitivity


The European otter (Lutra lutra) is a lively species which historically ranges all over Europe. In the second half of last century populations declined in North-West Europe, and at the end of the 1980s the species was declared extinct in the Netherlands. Several factors contributed to these declines, exposure to polychlorinated biphenyls (PCBs) and other contaminants was considered a prominent cause. PCBs can have different effects on organisms, primarily Ah-receptor mediated (see section on Receptor interactions). In order to assess the actual contribution of chemical exposure to the extinction of the otters, and the potential for population recovery it is essential to gain insight in the ratios between exposure levels and risk thresholds. However, since otters are rare and endangered, limited toxicological data is available on such thresholds. Most toxicological data is therefore inferred from research on another mustelids species the mink (Mustela vison) (Basu et al., 2007) a high trophic level, piscivorous species often used in toxicological studies. Several studies show that mink is quite sensitive to PCBs, showing e.g. effects on the length of the baculum of juveniles (Harding et al., 1999) and induction of hepatic enzyme systems and jaw lesions (Folland et al., 2016). Based on such studies, several threshold levels for otters were derived, depending on the toxic endpoints addressed. Based on number of offspring size and kit survival, EC50 were derived of approximately 1.2 to 2.4 mg/kg wet weight (Leonards et al., 1995), while for decreases  in vitamin A levels due to PCB exposure, a safety threshold of 4 mg/kg in blood was assessed (Murk et al., 1998).

To re-establish a viable population of otters in the Netherlands, a program was established in the mid-1990s to re-introduce otters in the Netherlands, including monitoring of PCBs and other organic contaminants in the otters. Otters were captured in e.g. Belarus, Sweden and Czech Republic. Initial results showed that these otters already contained < 1 mg/kg PCBs based on wet weight (van den Brink & Jansman, 2006), which was considered to be below the threshold limits mentioned before. Individual otters were radio-tagged, and most were recovered later as victims of car incidences. Over time, PCB concentrations had changed, although not in the same direction for all specimen. Females with high initial concentrations showed declining concentrations, due to lactation, while in male specimens most concentrations increased over time, as you would expect. Nevertheless, concentrations were in the range of the threshold levels, hence risks on effects could not be excluded. Since the re-introduction program was established in a relatively low contaminated area in the Netherlands, questions were raised for re-introduction plans in more contaminated areas, like the Biesbosch where contaminants may still affect otters .

To assess potential risks of PCB contamination in e.g. the Biesbosch for otter populations a modelling study was performed in which concentrations in fish from the Biesbosch were modelled into concentrations in otters. Concentrations of PCBs in the fish differed between species (lipid rich fish such as eel greater concentrations than lean white fish), size of the fish (larger fish greater concentrations than smaller fish) and between locations within the Biesbosch. Using Biomagnification Factors (BMFs) specific for each PCB-congener (see section on Complex mixtures), total PCB concentrations in lipids of otters were calculated based on fish concentrations and different compositions of fish diets of the otters (e.g. white fish versus eel, larger fish versus smaller fish, different locations). Different diets resulted in different modelled PCB concentrations in the otters, however all modelled concentrations were above the earlier mentioned threshold levels (van den Brink and Sluiter, 2015). This would indicate that risks of effects for otters could not be ruled out, and led to the notion that release of otters in the Biesbosch would not be the best option.

However, a major issue related to such risk assessment is whether the threshold levels derived from mink are applicable to otter. The resulting threshold levels for otter are rather low and exceedance of these concentrations has been noticed in several studies. For instance, in well-thriving Scottish otter populations PCBs levels have been recorded greater than 50 mg/kg lipid weight in livers (Kruuk & Conroy, 1996). This is an order of magnitude higher than the threshold levels, which would indicate that even at higher concentrations, at which effects are to be expected based on mink studies, populations of free ranging otters do not seem to be affected adversely. Based on this, the applicability of mink-derived threshold levels for otters may be open to discussion.

The case on otters showed that the derivation of ecological relevant toxicological threshold levels may be difficult due to the fact that otters are not regularly used in toxicity tests. Application of data from a related species, in this case the American mink, however, may be limited due to differences in sensitivity. In this case, this could result in too conservative assessments of the risks, although it should be noted that this may be different in other combinations of species. Therefore, the read across of information of closely related species should therefore be performed with great care.


References

Basu, N., Scheuhammer, A.M., Bursian, S.J., Elliott, J., Rouvinen-Watt, K., Chan, H.M. (2007). Mink as a sentinel species in environmental health. Environmental Research 103, 130-144.

Harding, L.E., Harris, M.L., Stephen, C.R., Elliott, J.E. (1999). Reproductive and morphological condition of wild mink (Mustela vison) and river otters (Lutra canadensis) in relation to chlorinated hydrocarbon contamination. Environmental Health Perspectives 107, 141-147.

Folland, W.R., Newsted, J.L., Fitzgerald, S.D., Fuchsman, P.C., Bradley, P.W., Kern, J., Kannan, K., Zwiernik, M.J. (2016). Enzyme induction and histopathology elucidate aryl hydrocarbon receptor-mediated versus non-aryl receptor-mediated effects of Aroclor 1268 in American Mink (Neovison vison). Environmental Toxicology and Chemistry 35, 619-634.

Kruuk, H., Conroy, J.W.H. (1996). Concentrations of some organochlorines in otters (Lutra lutra L) in Scotland: Implications for populations. Environmental Pollution 92, 165-171.

Leonards, P.E.G., De Vries, T.H., Minnaard, W., Stuijfzand, S., Voogt, P.D., Cofino, W.P., Van Straalen, N.M., Van Hattum, B. (1995). Assessment of experimental data on PCB‐induced reproduction inhibition in mink, based on an isomer‐ and congener‐specific approach using 2,3,7,8‐tetrachlorodibenzo‐p‐dioxin toxic equivalency. Environmental Toxicology and Chemistry 14, 639-652.

Murk, A.J., Leonards, P.E.G., Van Hattum, B., Luit, R., Van der Weiden, M.E.J., Smit, M. (1998). Application of biomarkers for exposure and effect of polyhalogenated aromatic hydrocarbons in naturally exposed European otters (Lutra lutra). Environmental Toxicology and Pharmacology 6, 91-102.

Van den Brink, N.W., Jansman, H.A.H. (2006). Applicability of spraints for monitoring organic contaminants in free-ranging otters (Lutra lutra). Environmental Toxicology & Chemistry 25, 2821-2826.


5.4. Trait-based approaches

Author: Paul J. Van den Brink

Reviewers: Nico van den Brink, Michiel Kraak, Alexa Alexander-Trusiak


Learning objectives:

You should be able to

  • describe how the characteristics (traits) of species determine their sensitivity, recovery and the propagation of effects to higher levels of biological organisation.
  • explain the concept of response and effect traits.
  • explain how traits-based approaches can be implemented into environmental risk assessment.


Keywords: Sensitivity, levels of biological organisation, species traits, recovery, indirect effects


Introduction

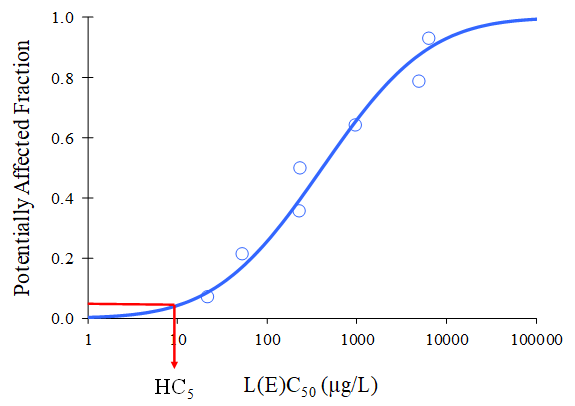
It is impossible to assess the sensitivity of all species to all chemicals. Risk assessments therefore, need methods to extrapolate the sensitivity of a limited number of species to all species present in the environment is desired. Statistical approaches, like the species sensitivity distribution concept, perform this extrapolation by fitting a statistical distribution (e.g. log-normal distribution) to a selected set of sensitivity data (e.g. 96h-EC50 data) in order to obtain a distribution of the sensitivity of all species. From this distribution a threshold value associated with the lower end of the distribution can be chosen and used as a protective threshold value (Figure 1).


Figure 1. Species sensitivity distribution (line) fitted through a set of EC50 values (dots) and the threshold value protective for at least 95% of the species (Hazardous Concentration 5%, corresponding to the potentially affected fraction of species of 5%) derived from this distribution.


The disadvantage of this approach is that it does not include mechanistic knowledge on what determines species’ sensitivity and uses species taxonomy rather than their characteristics. To overcome these and other problems associated with a taxonomy based approach (see Van den Brink et al., 2011 for a review) traits-based bioassessment approaches have been developed for assessing the effects of chemicals on aquatic ecosystem. In traits-based bioassessment approaches, species are not represented by their taxonomy but by their traits. A trait is a phenotypic or ecological characteristic of an organism, usually measured at the individual level but often applied as the average state/condition of a species. Examples of traits are body size, feeding habits, food preference, mode of respiration and lipid content. Traits describe the physical characteristics, ecological niche, and functional role of a species within the ecosystem. The recognized strengths of traits-based bioassessment approaches include: (1) traits add mechanistic and diagnostic knowledge, (2) traits are transferrable across geographies, (3) traits require no new sampling methodology as data that are currently collected can be used, (4) the use of traits has a long-standing tradition in ecology and can supplement taxonomic analysis.

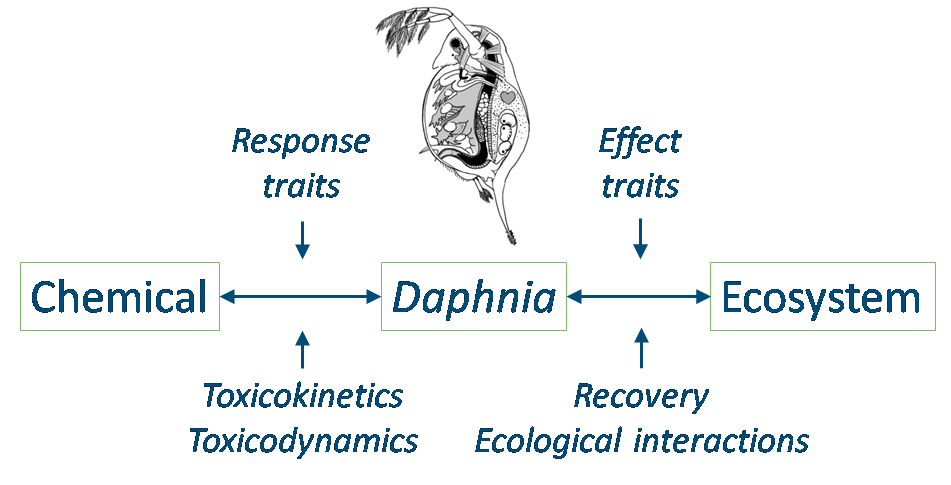
When traits are used to study effects of chemical stressors on ecosystem structure (community composition) and function (e.g. nutrient cycling) it is important to make a distinction between response and effects traits (Figure 2). Response traits are traits that enable a response of the species to the exposure to a chemical. An example of a response trait may be size related surface area of an organism. Smaller organisms have relatively large surface areas, because their surface to volume ratio is higher than for larger animals Herewith, the uptake rate of the chemical stressor is generally higher in smaller animals compared to larger ones (Rubach et al., 2012). Effects traits of organisms influence the surrounding environment by the organisms, by altering the structure and functioning of the ecosystem. An example of an effect trait is the food preference of an organism. For instance, if the small (response trait) and herewith sensitive organisms happen to be herbivorous (effect trait) an increase in algal biomass may be expected when the organisms are affected (Van den Brink, 2008). So, to be able to predict ecosystem level responses it is important to know the (cor)relations between response and effect traits as traits are not independent from each other but can be linked phylogenetically or mechanistically and thus form trait syndromes (Van den Brink et al., 2011).


Figure 2. Conceptual diagram showing how species’ traits determine both the sensitivity of species to chemicals and how the effects propagate to higher levels of biological organisation.


Predictive models for sensitivity using response traits

One of the holy grails of ecotoxicology is to find out which species traits make one species more sensitive to a chemical stressor than another one. In the past, two approaches have been used to assess the (cor)relationships between species traits and their sensitivity, one based on empirical correlations between species’ traits and their sensitivity as represented by EC50’s (Rico and Van den Brink, 2015) and one based on a more mechanistic approach using toxicokinetic/toxicodynamic experiments and models (Rubach et al., 2012). Toxicokinetic-toxicodynamic models (TKTD models) simulate the time-course of processes leading to toxic effects on organisms (Jager et al., 2011). Toxicokinetics describe what an individual does with the chemical and, in their simplest form, include the processes of uptake and elimination, thereby translating an external concentration of a toxicant to an internal body concentration over time (see Section on Toxicokinetics and Bioaccumulation). Toxicodynamics describes what the chemical does with the organism, herewith linking the internal concentration to the effect at the level of the individual organism over time (e.g., mortality) (Jager et al., 2011) (see Sections on Toxicokinetics and Bioaccumulation and on Toxicodynamics and Molecular Interactions). Rubach et al. (2012) showed that almost 90% of the variation in uptake rates and 80% of the variation in elimination rates of an insecticide in a range of 15 freshwater arthropod species could be explained by 4 species traits. These traits were: i) surface area (without gills), ii) detritivorous feeding, iii) using atmospheric oxygen and iv) phylogeny in case of uptake, and i) thickness of exoskeleton, ii) complete sclerotization, iii) using dissolved oxygen and iv) % lipid of dry weight in case of elimination. For most of these traits, a mechanistic hypothesis between the traits and their influence on the uptake and elimination can be made (Rubach et al., 2012). For instance, a higher surface area to volume ratio increases the uptake of the chemical, so uptake is expected to be higher in small animals compared to larger animals. This shows that it is possible to construct mechanistic models that are able to predict the toxicokinetics of chemicals in species and herewith the sensitivity of species to chemicals based on their traits.


The use of effect traits to model recovery and indirect effects

Traits determining the way organisms within an ecosystem react to chemical stress are related to the intrinsic sensitivity of the organisms on the one hand (response traits) and their recovery potential and food web relations (effect traits) on the other hand (Van den Brink, 2008). Recovery of aquatic invertebrates is, for instance, determined by traits like number of life cycles per year, the presence of insensitive life stages like resting eggs, dispersal ability and having an aerial life stage (Gergs et al., 2011) (Figure 3).


Figure 3. Effect and recovery patterns as observed for two mayfly species after a pulsed exposure to an insecticide. Both mayflies are equally susceptible to chlorpyrifos, but the species on the left (Cloeon dipterum) has many life cycles per year while the species to the right (Caenis horaria) has a full life cycle in spring (coinciding with the chlorpyrifos treatment) and a partial one in autumn.


Besides recovery, effect traits will also determine how individual level effects will propagate to higher levels of biological organisation like the community or ecosystem level. For instance, when Daphnia are affected by a chemical, their trait related to food preference (algae) will ensure that, under nutrient-rich conditions, the algae will not be subjected to top-down control and will increase in abundance. The latter effects are called indirect effects, which are not a direct result of the exposure to the toxicant but an indirect one through competition, food-web relationships, etc..


References

Gergs, A., Classen, S., Hommen, U. (2011). Identification of realistic worst case aquatic macroinvertebrate species for prospective risk assessment using the trait concept. Environmental Science and Pollution Research 18, 1316–1323.

Jager, T., Albert, C., Preuss, T.G., Ashauer, R. (2011). General unified threshold model of survival-A toxicokinetic-toxicodynamic framework for ecotoxicology. Environmental Science and Technology 45, 2529–2540

Rico, A., Van den Brink, P.J. (2015). Evaluating aquatic invertebrate vulnerability to insecticides based on intrinsic sensitivity, biological traits and toxic mode-of-action. Environmental Toxicology and Chemistry 34, 1907–1917.

Rubach, M.N., D.J. Baird, M-C. Boerwinkel, S.J. Maund, I. Roessink, Van den Brink P.J. (2012). Species traits as predictors for intrinsic sensitivity of aquatic invertebrates to the insecticide chlorpyrifos. Ecotoxicology 21, 2088-2101.

Van den Brink, P.J. (2008). Ecological risk assessment: from book-keeping to chemical stress ecology. Environmental Science and Technology 42, 8999–9004.

Van den Brink P.J., Alexander, A., Desrosiers, M., Goedkoop, W., Goethals, P., Liess, M., Dyer, S. (2011). Traits-based approaches in bioassessment and ecological risk assessment: strengths, weaknesses, opportunities and threats. Integrated Environmental Assessment and Management 7, 198-208.

5.5. Population models

Authors: A. Jan Hendriks and Nico van Straalen

Reviewers: Aafke Schipper, John D. Stark and Thomas G. Preuss


Learning objectives

You should be able to

  • explain the assumptions underlying exponential and logistic population modelling
  • calculate intrinsic population growth rate from a given set of demographic data
  • outline the conclusions that may be drawn from population modelling in ecotoxicology
  • indicate the possible contribution of population models to chemical risk assessment


Keywords: intrinsic rate of increase, carrying capacity, exponential growth,


Introduction

Ecological risk assessment of toxicants usually focuses on the risks run by individuals, by comparing exposures with no-effect levels. However, in many cases it is not the protection of individual plants or animals that is of interest but the protection of a viable population of a species in an ecological context. Risk assessment generally does not take into account the quantitative dynamics of populations and communities. Yet, understanding and predicting effects of chemicals at levels beyond that of individuals is urgently needed for several reasons. First, we need to know whether quality standards are sufficiently but not overly protective at the population level, when extrapolated from toxicity tests. Second, responses of isolated, homogenous cohorts in the laboratory may be different from those of interacting, heterogeneous populations in the field. Third, to set the right priorities in management, we need to know the relative and cumulative effect of chemicals in relation to other environmental pressures.

Ecological population models for algae, macrophytes, aquatic invertebrates, insects, birds and mammals have been widely used to address the risk of potentially toxic chemicals, however, until recently, these models were only rarely used in the regulatory risk assessment process due to a lack of connection between model output and risk assessment needs (Schmolke et al., 2010). Here, we will sketch the basic principles of population dynamics for environmental toxicology applications.


Exponential growth

Ecological textbooks usually start their chapter on population ecology by introducing exponential and logistic growth. Consider a population of size N. If resources are unlimited, and the per capita birth (b) and death rates (d) are constant in a population closed to migration, the number of individuals added to the population per time unit (dN/dt) can be written as:


\({dN\over dt} = (b-d) N(t) \)     or     \({dN\over dt} = r N(t) \)


where r is called the intrinsic rate of increase. This differential equation can be solved with boundary condition N(0) = N0 to yield


\(N(t) = N_0\ e^{rt}\)


This is the well-known equation for exponential growth (Figure 1a). It applies for example, to animal populations early in the growing season or when they have colonized a new environment. The global human population has also seen exponential growth during most of its existence. The tendency for any population to grow exponentially was recognized by Malthus in his book “An Essay on Population”, published in 1789, and it helped Darwin to formulate his theory of evolution by natural selection.


Figure 1. Population density as a function of time for exponential (a), logistic (b) and oscillating (c) populations without (blue) and with (red) exposure to toxicants. N = density, N(∞) equilibrium density, N1 = resource density, N2 = consumer density. Drawn by Wilma IJzerman.


Since toxicants will affect either reproduction or survival, or both, they will also affect the exponential growth rate (Figure 1a). This suggests that r can be considered a measure of population performance under toxic stress. But rather than from observed population trajectories, r is usually estimated from life-history data. We know from basic demographic theory that any organism with “time-invariant” vital rates (that is, fertility and survival may depend on age, but not on time), will be growing exponentially at rate r. The intrinsic rate of increase can be derived from age-specific survival and fertility rates using the so-called Euler-Lotka equation, which reads:


\(\int\limits_0^{x_m} l(x)\ m(x)\ e^{–rx}\ dx=1\)


in which x is age, xm maximal age, l(x) survivorship from age zero to age x and m(x) the number of offspring produced per time unit at age x. Unfortunately this equation does not allow for a simple derivation of r; r must be obtained by iteration and the correct value is the one that, when combined with the l(x) and m(x) data, makes the integral equal to 1. Due to this complication approximate approaches are often applied. For example, in many cases a reasonably good estimate for r can be obtained from the age at first reproduction α, survival to first reproduction, S, and reproductive output, m, according to the following formula:


\(r = {ln(S\ m)\over \alpha}\)


This is due to the fact that for many animals in the environment, especially those with high reproductive output and low juvenile survivorship, age at first reproduction is the dominant variable determining population growth (Forbes and Calow, 1999).

The classical demographic modelling approach, including the Euler-Lotka equation, considers time as a continuous variable and solves the equations by calculus. However, there is an equivalent formalism based on discrete time, in which population events are assumed to take place only at equidistant moments. The vital rates are then summarized in a so-called Leslie matrix, a table of survival and fertility scores for each age class, organized in such a way that when multiplied by the age distribution at any moment, the age distribution at the following time point is obtained. This type of modelling lends itself more easily to computer simulation. The outcome is much the same: if the Leslie matrix is time-invariant the population will grow each time step by a factor λ, which is related to r as ln λ = r (λ = 1 corresponds to r = 0). Mathematically speaking λ is the dominant eigenvalue of the Leslie matrix. The advantage of the discrete-time version is that λ can be more easily decomposed into its component parts, that is, the life-history traits that are affected by toxicants (Caswell, 1996).

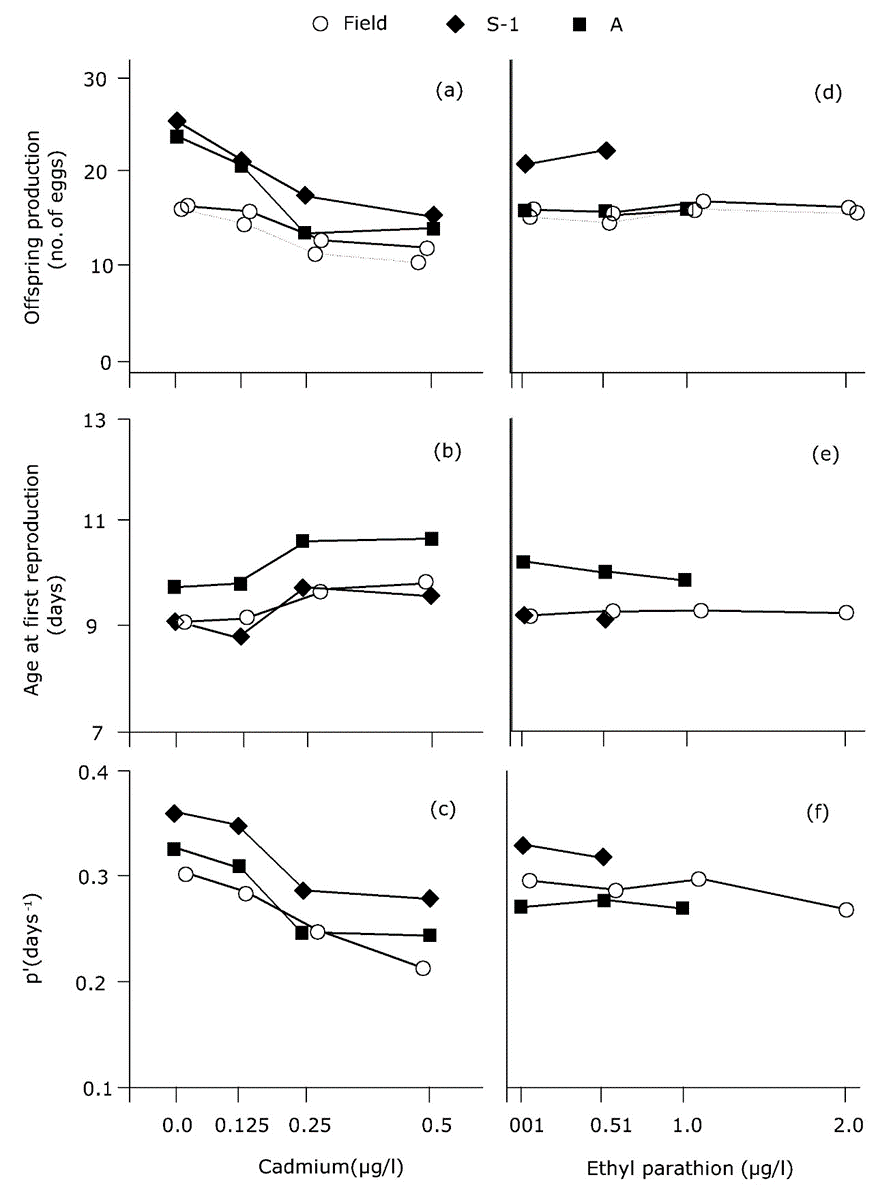
The demographic approach to exponential growth has been applied numerous times in environmental toxicology, most often in studies of water fleas (Suhett et al., 2015), and insects (Stark and Banks, 2003). The tests are called “life-table response experiments” (see section on Population ecotoxicology in a laboratory setting). The investigator observes the effects of toxicants on age-specific survival and fertility, and calculates r as a measure of population performance for each exposure concentration. An example is given in Figure 2, derived from a study by Barata et al. (2000). Forbes and Calow (1999) concluded that the use of r in ecotoxicology adds ecological relevance to the analysis, but it does not necessarily provide a more sensitive or less sensitive endpoint: r is as sensitive as the vital rates underlying its estimation.


Figure 2. Example of results obtained in life-table response experiments with the water flea Daphnia magna. Cohorts of water fleas were cultured from field-collected resting eggs (ephippia) and two clonal lines under continuous culture in the laboratory (S-1 and A). Responses are shown for offspring production, age at first reproduction and the calculated intrinsic rate of population increase, as a function of cadmium and ethyl-parathion. Redrawn from Barata et al (2000) by Wilma IJzerman.


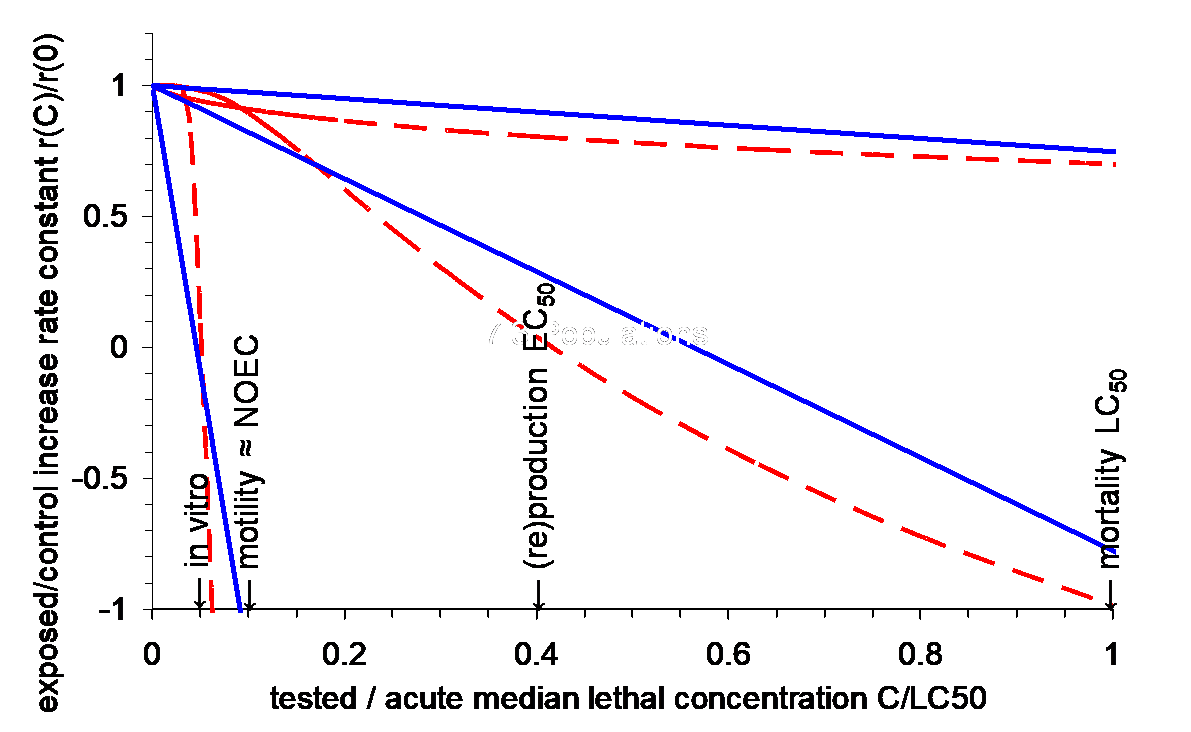
Hendriks et al. (2005) postulated that r should show a near-linear decrease with the concentration of a chemical, scaled to the LC50 (Figure 3). This relationship was confirmed in a meta-analysis of 200 laboratory experiments, mostly concerning invertebrate species (Figure 3). Anecdotal underpinning for large vertebrates comes from field cases where pollution limits population development.


Figure 3. Modelled (red, μ ± 95% CI) and measured (blue, 5%-, 50%- and 95%-percentiles) population increase rates of organisms as a function of toxicant exposure concentrations C. Population growth r is expressed as the value observed in exposed organisms (r(C)) relative to the value in the control situation (r(0)) The exposure concentrations C, are scaled relative to the median lethal concentration LC50 of the toxicant. Characteristic (average) sub-lethal endpoints are given as a reference. The regression lines (individual data points not shown) are derived from a meta-analysis comprising 200 published laboratory experiments (adapted after Hendriks et al., 2005).


Logistic growth

As exponentially growing populations are obviously rare, models that include some form of density-dependence are more realistic. One common approach is to assume that the birth rate b decreases with density due to increasing scarcity of resources. The simplest assumption is a linear decrease with N, expressed as follows:


\({dN\over dt} = rN(t)\ (1\ - {N(t)\over K})\)


In this equation r is the maximum value of the per capita growth rate (1/N(t) dN/dt), realized at low density and K is a new parameter, the density at which dN/dt becomes zero (Figure 1b). This is the density at which the population will reach equilibrium, also called carrying capacity: N(∞) = K. The resulting model is known as the logistic model, also called the Verhulst-Pearl equation, described in 1844 by François Verhulst and rediscovered in 1920 by Raymond Pearl. The solution of the logistic differential equation is a bit more complicated than in the case of simple exponential growth, but can be obtained by regular calculus to read:


\(N(t) = {K\over {1\ +\ ({{K\ -\ N_0}\over N_0})}\ e^{-rt}}\)


This equation defines an S-shaped curve with density beginning on t = 0 with N0 and increasing asymptotically towards K (Figure 1b).

The question is, can the parameters of the logistic growth equation be used to measure population performance like in the case of exponential growth? Practical application is limited because the carrying capacity is difficult to measure under natural and contaminated conditions. Many field populations of arthropods, for example, fluctuate widely due to predator-prey dynamics, and hardly ever reach their carrying capacity within a growing season. An experimental study on the springtail Folsomia candida (Noël et al., 2006) showed that zinc in the diet did not affect the carrying capacity of contained laboratory populations, although there were several interactions below K that were influenced by zinc, including hormesis (growth stimulation by low doses of a toxicant), and Allee effects (loss of growth potential at low density due to lower encounter rate).

Density-dependence is expected to act as buffering mechanism at the population level because toxicity-induced population decline diminishes competition, however, the effects very much depend on the details of population regulation. This was demonstrated in a model for peregrine falcon exposed to DDE and PBDEs (Schipper et al., 2013). While the equilibrium size of the population declined by toxic exposure, the probability of individual birds finding a suitable territory increased. However, at the same time the number of non-breeding birds shifting to the breeding stage became limiting and this resulted in a strong decrease in the equilibrium number of breeders.


Mechanistic effect models

To enhance the potential for application of population models in risk assessment, more ecological details of the species under consideration must be included, e.g. effects of dispersal, abiotic factors, predators and parasites, dispersal, landscape structure and many more. A further step is to track the physiology and ecology of each individual in the population. This is done in the dynamic energy budget modelling approach (DEB) developed by (Kooijman et al., 2009). By including such details, a model will become more realistic, and more precise predictions can be made on the effects of toxic exposures. These types of models are generally called “mechanistic effect models’ (MEMs). They allow a causal link between the protection goal, a scenario of exposure to toxicants and the adverse population effects generated by model output (Hommen et al., 2015). The European Food Safety Authority (EFSA) in 2014 issued an opinion paper containing detailed guidelines on the development of such models and how to adjust them to be useful in the risk assessment of plant protection products.


References

Caswell, H. (1996). Demography meets ecotoxicology: untangling the population level effects of toxic substances. In: Newman, M.C., Jagoe, C.H. (Eds.). Ecotoxicology. A hierarchical treatment. Lewis Publishers, Boca Raton, pp. 255-292.

Barata, C., Baird, D.G., Amata, F., Soares, A.M.V.M. (2000). Comparing population response to contaminants between laboratory and field: an approach using Daphnia magna ephippial egg banks. Functional Ecology 14, 513-523.

EFSA (2014). Scientific Opinion on good modeling practice in the context of mechanistic effect models for risk assessment of plant protection products. EFSA Panel on Plant Protection and their Residues (PPR). EFSA Journal 12, 3589.

Forbes, V.E., Calow, P. (1999). Is the per capita rate of increase a good measure of population-level effects in ecotoxicology. Environmental Toxicology and Chemistry 18, 1544-1556.

Hendriks, A.J., Maas, J.L., Heugens, E.H.W., Van Straalen, N.M. (2005). Meta-analysis of intrinsic rates of increase and carrying capacity of populations affected by toxic and other stressors. Environmental Toxicology and Chemistry 24, 2267-2277

Hommen, U., Forbes, V., Grimm, V., Preuss, T.G., Thorbek, P., Ducrot, V. (2015). How to use mechanistic effect models in environmental risk assessment of pesticides: case studies and recommendations from the SETAC workshop Modelink. Integrated Environmental Assessment and Management 12, 21-31.

Kooijman, S.A.L.M., Baas, J., Bontje, D., Broerse, M., Van Gestel, C.A.M., Jager, T. (2009). Ecotoxicological Applications of Dynamic Energy Budget theory. In: Devillers, J. (Ed.). Ecotoxicology Modeling, Volume 2, Springer, Dordrecht, pp. 237-260.

Noël, H.L., Hopkin, S.P., Hutchinson, T.H., Williams, T.D., Sibly, R.M. (2006). Towards a population ecology of stressed environments: the effects of zinc on the springtail Folsomia candida. Journal of Applied Ecology 43, 325-332.

Schipper, A.M., Hendriks, H.W.M., Kaufmann, M.J., Hendriks, A.J., Huijbregts, M.A.J. (2013). Modelling interactions of toxicants and density dependence in wildlife populations. Journal of Applied Ecology 50, 1469–1478.

Schmolke, A., Thorbek, P., Chapman, P., Grimm, V. (2010) Ecological models and pesticide risk assessment: current modelling practice. Environmental Toxicology and Chemistry 29, 1006-1012.

Stark, J.D., Banks, J.E. (2003) Population effects of pesticides and other toxicants on arthropods. Annual Review of Entomology 48, 505-519.

Suhett, A.L. et al. (2015) An overview of the contribution of studies with cladocerans to environmental stress research. Acta Limnologica Brasiliensia 27, 145-159.

5.6. Metapopulations

Author: Nico van den Brink

Reviewers: Michiel Kraak, Heikki Setälä,


Learning objectives

You should be able to

  • explain the relevance of meta-population dynamics for environmental risks of chemicals
  • name the important mechanisms linking meta-populations to chemical risks


Implications of meta-population dynamics on risks of environmental chemicals

Populations can be defined as a group of organisms from the same species which live in a specific geographical area. These organisms interact and breed with each other. At a higher level, one can define meta-populations which can be described as a set of spatially separated populations which interact to a certain extent. The populations may function separately, but organisms can migrate between the populations. Generally the individual populations occur in more or less favourable habitat patches which may be separated by less favourable areas. However, in between populations, good habitats may also occur, where populations have not yet established , or the local populations may have gone extinct. Exchange between populations within a meta-population depends on i) the distances between the individual populations, ii) the quality of the habitat between the populations, e.g. the availability of so-called stepping stones, areas where organisms may survive for a while but which are too small or of too low habitat quality to support a local population and iii) the dispersal potential of the species. Due to the interactions between the different populations within a meta-population, chemicals may affect species at levels higher than the (local) population, also at non-contaminated sites.

An important effect of chemicals at meta-population scale is that local populations may act as a source or sink for other populations within the meta-population. When a chemical affects the survival of organisms in a local population, the local population densities decline. This may increase the immigration of organisms from neighbouring populations within the meta-population. Decrease of local densities would decrease  emigration, resulting in a net-influx of organisms into the contaminated site. This is the case when  organisms do not sense the contaminants, or that the contaminants do not alter the habitat quality for the organisms. In case the immigration rate at the delivering/source population to replace the populations is too high to replace the leaving organisms, population densities in neighbouring populations may decline, even at the non-contaminated source sites. Consequently, local populations at contaminated sites may act as a sink for other populations within the meta-population, so chemicals may have a much broader impact than just local.

On the contrary, when the local population is relatively small, or the chemical stress is not chronic, meta-population dynamics may also mitigate local chemical stress. Population level impacts of chemicals may be minimised by influx of organisms of neighbouring populations, potentially recovering the population densities prior to the chemical stress. Such recovery  depends on the extent and duration of the chemical impact on the local populations and the capacity of the other populations to replenish the loss of the organisms in the affected population.

Meta-population dynamics may thus alter the extent to which contaminants may affect local populations _ through migration between populations. However, chemicals may affect the total carrying capacity of the meta-population as a whole. This can be illustrated by the modelling approach developed by Levins in the late 1960s (Levins 1969). A first assumption in this model is that not all patches that can potentially carry a local population are actually occupied, so let F be the fraction of occupied patches (1-F being the fraction not occupied). Populations have an average change of extinction being e (day-1 when calculating on a daily base), while non-occupied patches have a change of c of being populated (day-1) from the populated patches. The daily change in numbers of occupied patches is therefore:

\({dF\over dt} = c*F*(1-F)\ -\ e*F\)

In this formula c*F*(1-F) equals the number of non-occupied patches that are being occupied from the occupied patches, while e * F equals the fraction of patches that go extinct during the day. This can be recalculated to a carrying capacity (CC) of

\(CC = 1\ -\ {e\over c}\)

while the growth rate (GR) of the meta-population can be calculated by

\(GR = c\ -\ e\)

In case chemicals increase extinction risk (e), or decrease the chance on establishment in a new patch (c) this will affect the CC (which will decrease because e/c will increase) as well as the GR (will decrease, may even go below 0). However, this model uses average coefficients, which may not be directly applicable to individual contaminated sites within a meta-population. More (complex) recent approaches include the possibility to use local-population specific parameters and even more, such model include stochasticity, increasing their environmental relevance.

Besides affecting populations directly in their habitats, chemicals may also affect the areas between habitat patches. This may affect the potential of organisms to migrate between patches. This may decrease the chances of organisms to repopulate non-occupied patches, i.e. decrease c, and as such both CC and GR. Hence, in a meta-population setting chemicals even in a non-preferred habitat may affect long term meta-population dynamics.


References

Levins, R. (1969). Some demographic and genetic consequences of environmental heterogeneity for biological control. Bulletin of the Entomological Society of America 15, 237–240

5.7. Community ecotoxicology

5.7.1. Community Ecotoxicology: theory and concepts

Authors: Michiel Kraak and Ivo Roessink

Reviewers: Kees van Gestel, Nico van den Brink, Ralf B. Schäfer


Learning objectives:

You should be able to

  • motivate the importance of studying ecotoxicology at the community level.
  • define community ecotoxicology and to name specific phenomena at the community and ecosystem level.
  • explain the indirect effects observed in community ecotoxicology.
  • explain how communities can be studied and how data from experiments at the community level can be analyzed.
  • interpret community ecotoxicity data and to explain related challenges.


Keywords: Community ecotoxicology, species interactions, indirect effects, mesocosm, ecosystem processes.


Introduction

The motivation to study ecotoxicological effects at the community level is that generally the targets of environmental protection are populations, communities and ecosystems. Consequently, when scaling up research from the molecular level, via cells, organs and individual organisms towards the population, community or even ecosystem level the ecological and societal relevance of the obtained data strongly increase (Figure 1). Yet, the difficulty of obtaining data increases, due to the increasing complexity, lower reproducibility and the increasing time needed to complete the research, which typically involves higher costs. Moreover, when effects are observed in the field it may be difficult to link these to specific chemicals and to identify the drivers of the observed effects. Not surprisingly, ecotoxicological effects at the community and ecosystem level are understudied.


Figure 1. Characteristics of ecotoxicological research performed at different levels of biological organization.


Community Ecotoxicology: definition and indirect effects

Community ecology is defined as the study of the organization and functioning of communities, which are assemblages of interacting populations of species living within a particular area or habitat. Building on this definition, community ecotoxicology is defined as the study of the effects of toxicants on patterns of species abundance, diversity, community composition and species interactions. These species interactions are unique to the community and ecosystem level and may cause direct effects of toxicants on specific species to exert indirect effects on other species. It has been estimated that the majority of effects at these levels of biological organization are indirect rather than direct. These indirect effects are exerted via:

  • predator-prey relationships
  • consumer-producer relationships
  • competition between species
  • parasite-host relationships
  • symbiosis
  • biotic environment


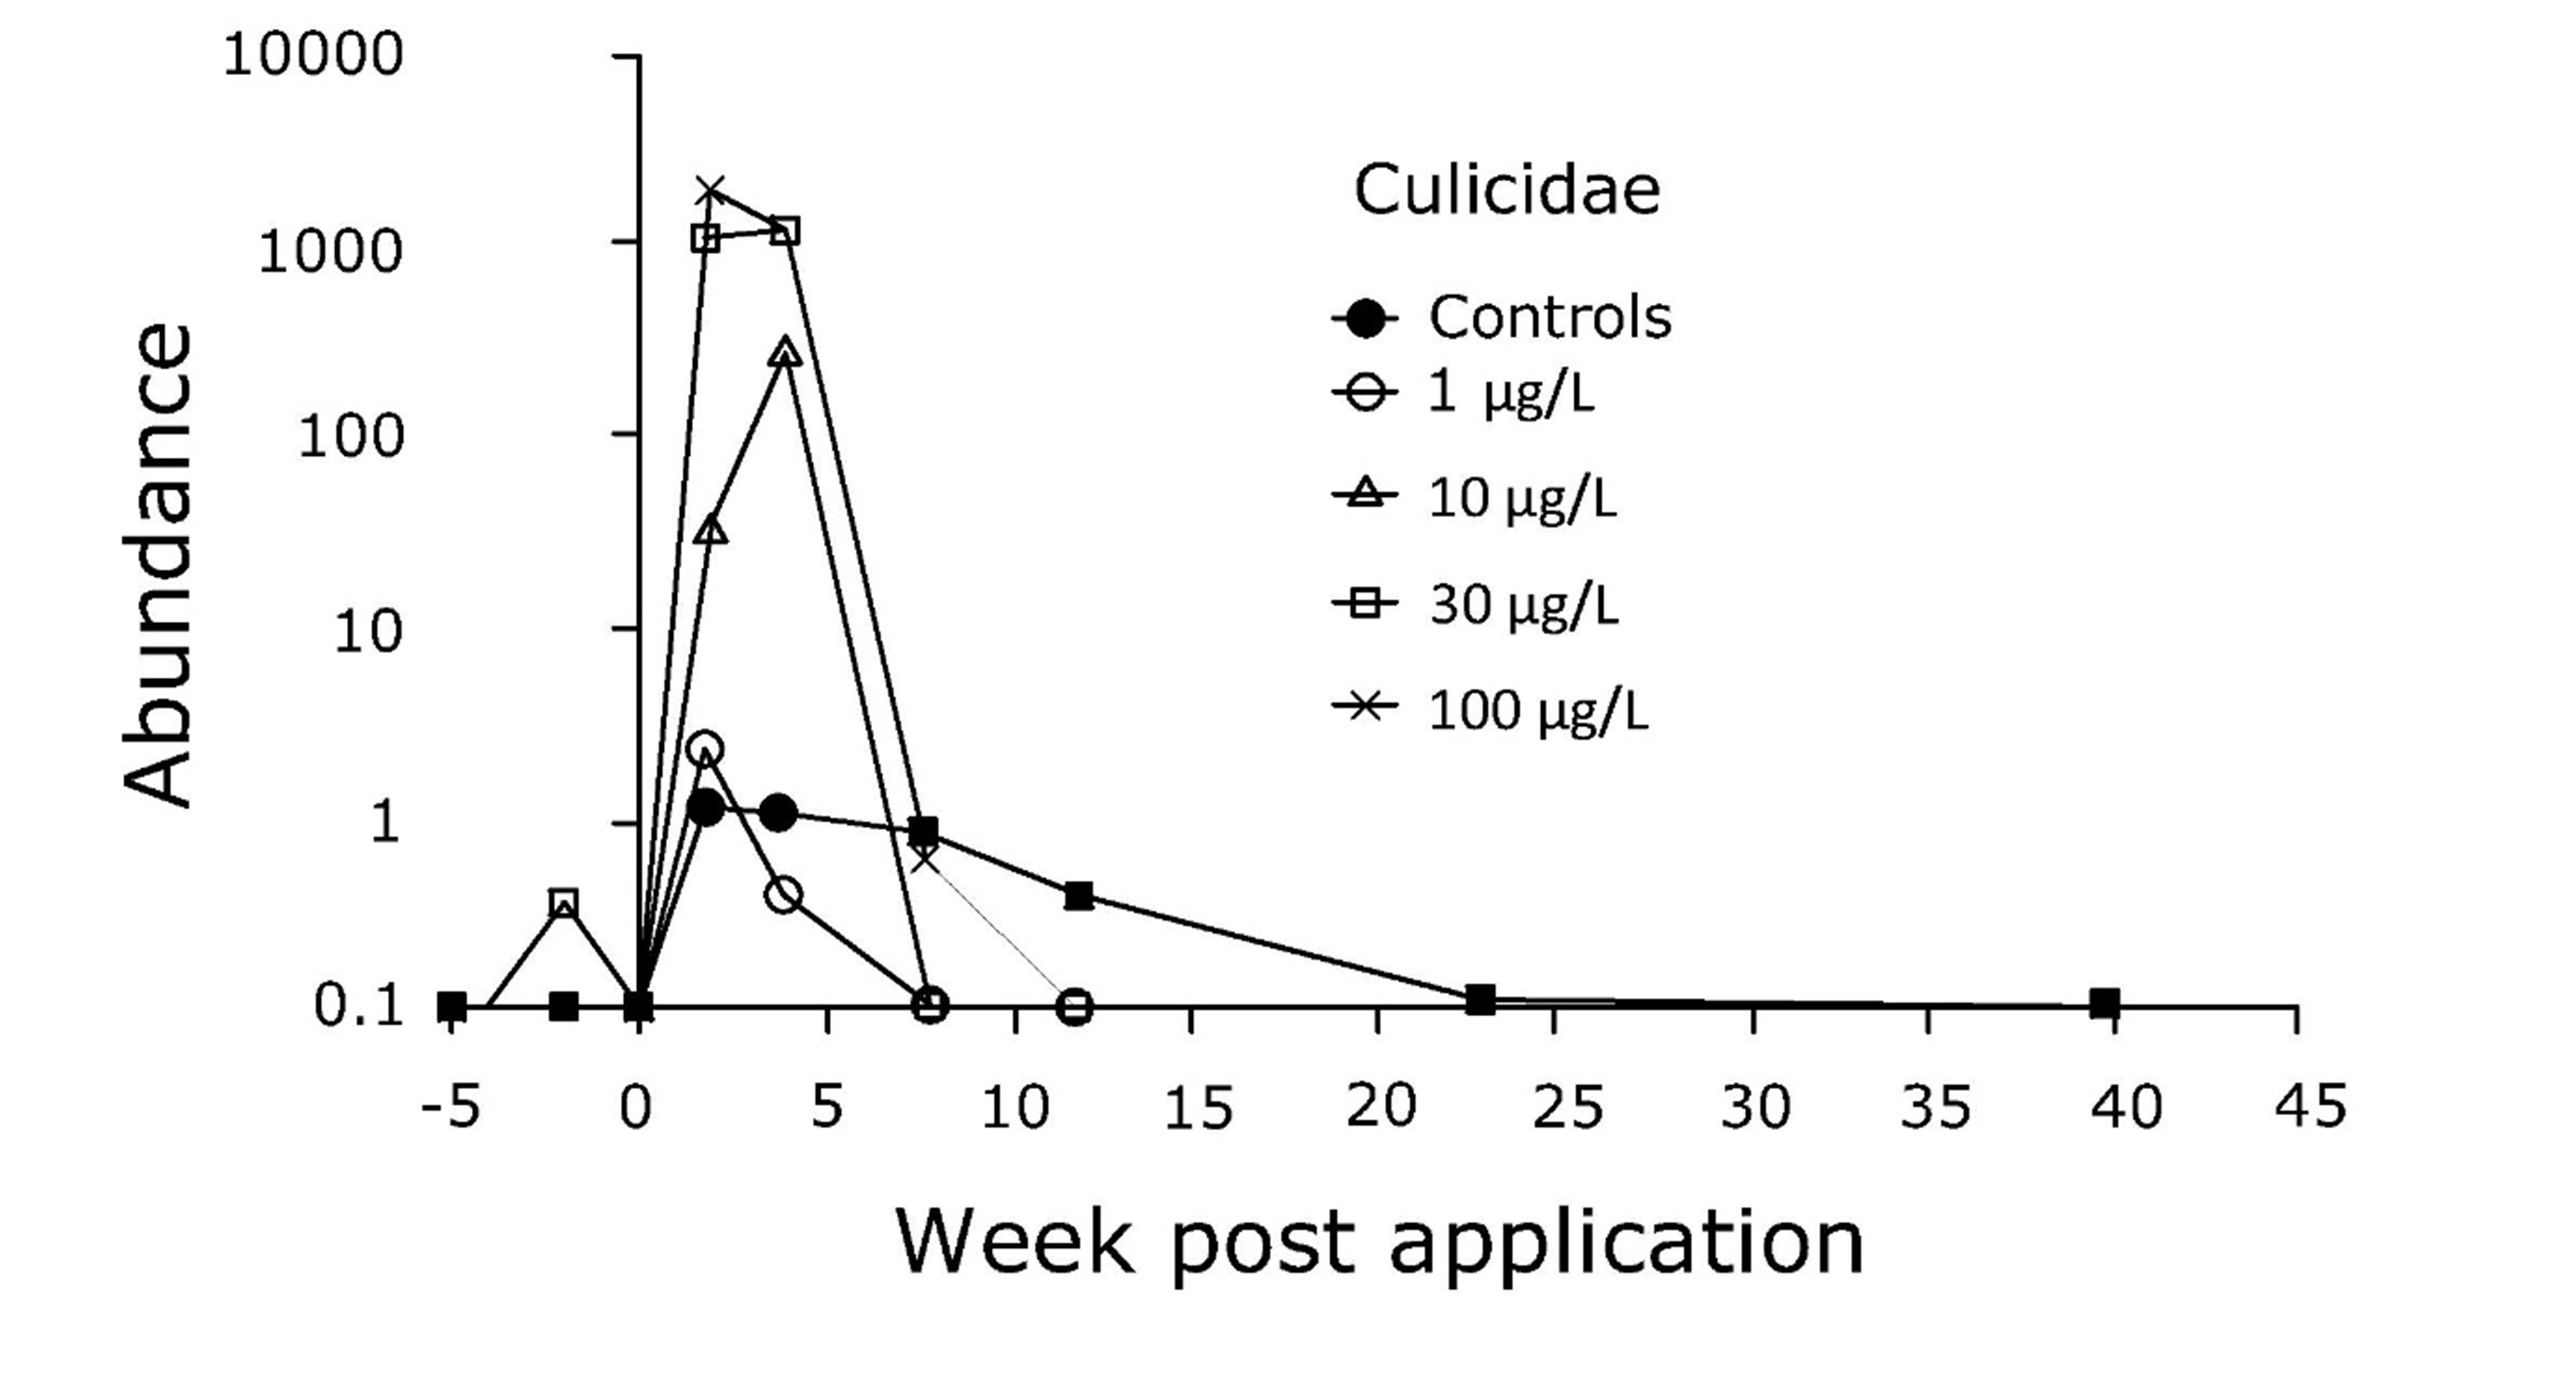
As an example, Roessink et al. (2006) studied the impact of the fungicide triphenyltin acetate (TPT) on benthic communities in outdoor mesocosms. For several species a dose-related decrease in abundance directly after application was observed, followed by a gradual recovery coinciding with decreasing exposure concentrations, all implying direct effects of the fungicide. For some species, however, opposite results were obtained and abundance increased shortly after application, followed by a gradual decline; see the example of the Culicidae in Figure 2. In this case, these typical indirect effects were explained by a higher sensitivity of the predators and competitors of the Culicidae. Due to diminished predation and competition and higher food availability abundances of the Culicidae temporarily increased after toxicant exposure. With the decreasing exposure concentrations over time, the populations of the predators and competitors recovered, leading to a subsequent decline in numbers of the Culicidae.


Figure 2. Dynamics of Culicidae in cosms treated with the fungicide triphenyltin acetate. Redrawn from Roessink et al. (2006) by Wilma IJzerman.


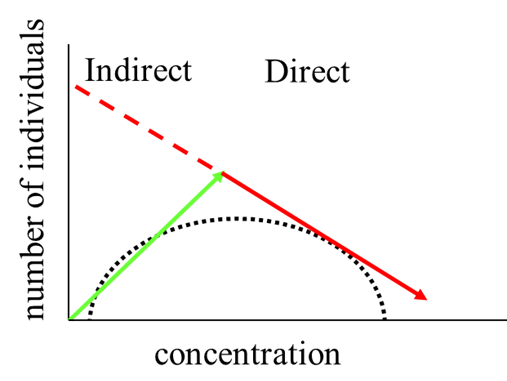
The indirect effects described above are thus due to species-specific sensitivities to the compound of interest, which influence the interactions between species. Yet, at higher exposure concentrations also the less sensitive species will start to be affected by the chemical. This may lead to an “arch-shaped” relationship between the number of individuals of a certain species and the concentration of a toxicant. In a mesocosm study with the insecticide lambda-cyhalothin this was observed for Daphnia, which are prey for the more sensitive phantom midge Chaoborus (Roessink et al., 2005; Figure 3). At low exposure concentrations the indirect effects, such as release from predation by Chaoborus, led to an increase in abundance of the less sensitive Daphnia. At intermediate exposure concentrations there was a balance between the positive indirect effects and the adverse direct effects of the toxicant. At higher exposure concentrations the adverse direct effects overruled the positive indirect effects resulting in a decline in abundance of the Daphnia. These combined dose dependent direct and indirect effects are inherent to community-level experiments, but are compound and species-interaction specific.


Figure 3. Arch-shaped relationship between the number of individuals of a certain species in a community-level experiment and the concentration of a toxicant, caused by the combination of indirect positive effects at low exposure concentrations and adverse direct effects at higher exposure concentrations.


Investigating communities and analysing and interpreting community ecotoxicity data

To study community ecotoxicology, experiments have to be scaled up and are therefore often performed in mesocosms, artificial ponds, ditches and streams, or even in the field, sometimes accompanied by the use of in- and exclosures. To assess the effects of toxicants on communities in such large systems requires meticulous sampling schemes, which often make use of artificial substrates and e.g. emergence traps for aquatic invertebrates with terrestrial adult life stages (see section on Community ecotoxicology in practice).

Alternatively to scaling up the experiments in community ecotoxicology, the size of the communities may be scaled down. Algae and bacteria grown on coin sized artificial substrates in the field or in experimental settings provide the unique advantage that the experimental unit is actually an entire community.

Given the large scale and complexity of experiments at the community level, such experiments generally generate overwhelming amounts of data, making appropriate analysis of the results challenging. Data analysis focusing on individual responses, so-called univariate analysis, that suffice in single species experiments, obviously falls short in community ecotoxicology, where cosm or (semi-)field communities sometimes consist of over a hundred different species. Hence, multivariate analysis is often more appropriate, similar to the approaches frequently applied in field studies to identify possible drivers of patterns in species abundances. Alternative approaches are also applied, like using ecological indices such as species richness or categorizing the responses of communities into effect classes (Figure 4). To determine if species under semi-field conditions respond equally sensitive to toxicant exposure as in the laboratory, the construction and subsequent comparison of species sensitivity distributions (SSD) (see section on SSDs) may be helpful.


Figure 4. Effect classes to categorize the responses of communities in community-level experiments.


The analysis and interpretation of community ecotoxicity data is also challenged by the dynamic development of each individual replicate cosm, artificial pond, ditch or stream, including those from the control. From the start of the experiment, each control replicate develops independently, matures, and at the end of the experiments that generally last for several months control replicates may differ not only from the treatments, but also among each other. The challenge is then to separate the toxic signal from the natural variability in the data.

In experiments that include a recovery phase, it is frequently observed that previously exposed communities do recover, but develop in another direction than the controls, which actually challenges the definition of recovery. Moreover, recovery can be decelerated or accelerated depending on the dispersal capacity of the species potentially inhabiting the cosms and the distance to nearby populations within a metapopulation (see section on Metapopulations). Other crucial factors that may affect the impact of a toxicant on communities, as well as their recovery from this toxicant exposure include habitat heterogeneity and the state of the community in combination with the moment of exposure. Habitat heterogeneity may affect the distribution of toxicants over the different environmental compartments and may provide shelter to organisms. Communities generally exhibit temporal dynamics in species composition and in their contribution to ecosystem processes (see section on Structure versus function), as well in the lifecycle stages of the individual species. Exponentially growing populations recover much faster than populations that reached carrying capacity and for almost all species, young individuals are up to several orders of magnitude more sensitive than adults or late instar larvae (see section on Population ecotoxicology). Hence, the timing of exposure to toxicants may seriously affect the extent of the adverse effects, as well as the recovery potential of the exposed communities.


From community ecotoxicology towards ecosystems and landscapes

When scaling up from the community to the ecosystem level, again unique characteristics emerge: structural characteristics like biodiversity, but also ecosystem processes, quantified by functional endpoints like primary production, ecosystem respiration, nutrient cycling and decomposition. Although a good environmental quality is based on both ecosystem structure and functioning, there is definitely a bias towards ecosystem structure, both in science and in policy (see section on Structure versus function). Levels of biological organisation higher than ecosystems are covered by the field of landscape ecotoxicology (see section on Landscape ecotoxicology) and in a more practical way by the concept of ecosystem services (see section on Ecosystem services).


References

Roessink, I., Crum, S.J.H., Bransen, F., Van Leeuwen, E., Van Kerkum, F., Koelmans, A.A., Brock, T.C.M. (2006). Impact of triphenyltin acetate in microcosms simulating floodplain lakes. I. Influence of sediment quality. Ecotoxicology 15, 267-293.

Roessink, I., Arts, G.H.P., Belgers, J.D.M., Bransen, F., Maund, S.J., Brock, T.C.M. (2005). Effects of lambda-cyhalothrin in two ditch mesocosm systems of different trophic status. Environmental Toxicology and Chemistry 24, 1684-1696.


Further reading

Clements, W.H., Newman, M.C. (2002). Community Ecotoxicology. John Wiley & Sons, Ltd.

5.7.2. Community ecotoxicology in practice

Author: Martina G. Vijver

Reviewers: Paul J. van den Brink, Kees van Gestel


Learning objectives:

To be able to

  • describe the variety of ecotoxicological test systems available to address different research questions.
  • explain what type of information is gained from low as well as higher level ecotoxicological tests.
  • explain the advantages and disadvantages of different higher level ecotoxicological test systems


Keywords: microcosms, mesocosms, realism, different biological levels


Introduction: Linking effects at different levels of biological organization

It is generally anticipated that ecotoxicological tests should provide data useful for making realistic predictions of the fate and effects of chemicals in natural ecosystems (Landner et al., 1989). The ecotoxicological test, if used in an appropriate way, should be able to identify the potential environmental impact of a chemical before it has caused any damage to the ecosystem. In spite of the considerable amount of work devoted to this problem and the plethora of test methods being published, there is still reason to question whether current procedures for testing and assessing the hazard of chemicals in the environment do answer the questions we have asked. Most biologists agree that at each succeeding level of biological organization new properties appear that would not have been evident even by the most intense and careful examination of lower levels of organization (Cairns Jr., 1983).

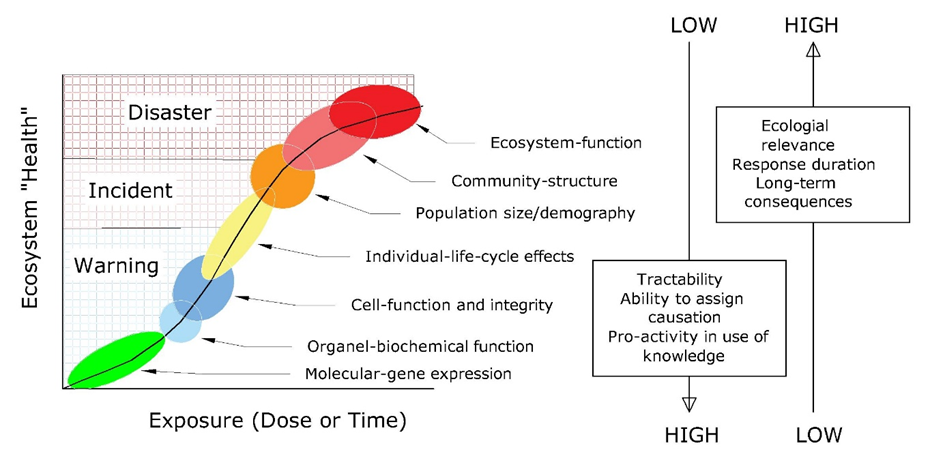
These levels of biological hierarchy might be crudely characterized as subcellular, cellular, organ, organism, population, multispecies, community, and ecosystem (Figure 1). At the lower biological level, responses are faster than those occurring at higher levels of organization.


Figure 1: Tests at different biological levels, from molecule to ecosystem scale (modified from Newman, 2008). Each biological level is of equal importance in environmental toxicology, but has a different implication to the ecosystem health. If the fitness at the gene to the individual species level is affected due to exposure, this can be seen as a warning for the ecosystem health. If the impact of exposure can be detected at individual species (e.g. reproductive output) to population levels, this can be seen as an incident. If the impact of exposure is detectable at the community (structure and functioning) level, this is considered a disaster for ecosystem health. Measurements performed at the different biological level inform us differently: at the higher biological levels in general more ecological realism regarding exposure as well as species-interactions is gained, whereas at the lower biological levels causality and tractability of the link between the response and the dose of chemicals is achieved. Drawn by Wilma IJzerman.


Experiments executed at the lower biological level often are performed under standard laboratory conditions (see Section on Toxicity testing). The laboratory setting has advantages like allowing for replication, the use of relatively easy and simplified conditions that enable outcomes that are rather robust across different laboratories, the stressor of interest being more traceable under optimal stable conditions, and easy repetition of experiments. As a consequence, at the lower biological level the responses of organisms to chemical stressors tend to be more tractable, or more causal, than those identified when studying effects at higher tiered levels.

The merit to perform cosm studies, so at the higher biological level (see Figure 1), is to investigate the impact of a stressor on a variety of species, all having interactions with each other. This enables detecting both direct and indirect effects on the structure of species assemblages due to the chemicals. Indirect effects can become manifest as disruptions of species interactions, e.g. competition, predator-prey interactions and the like. A second important reason for conducting cosm studies is that abiotic interactions at the level of the ecosystem can be accounted for, allowing for measurement of effects of chemicals under more environmentally realistic exposure conditions. Conditions that likely influence the fate and behavior of chemical are sorption to sediments and plants, photolysis, changes in pH (see section on Bioavailability for a more detailed description), and other natural fluctuations.


What are cosm studies?

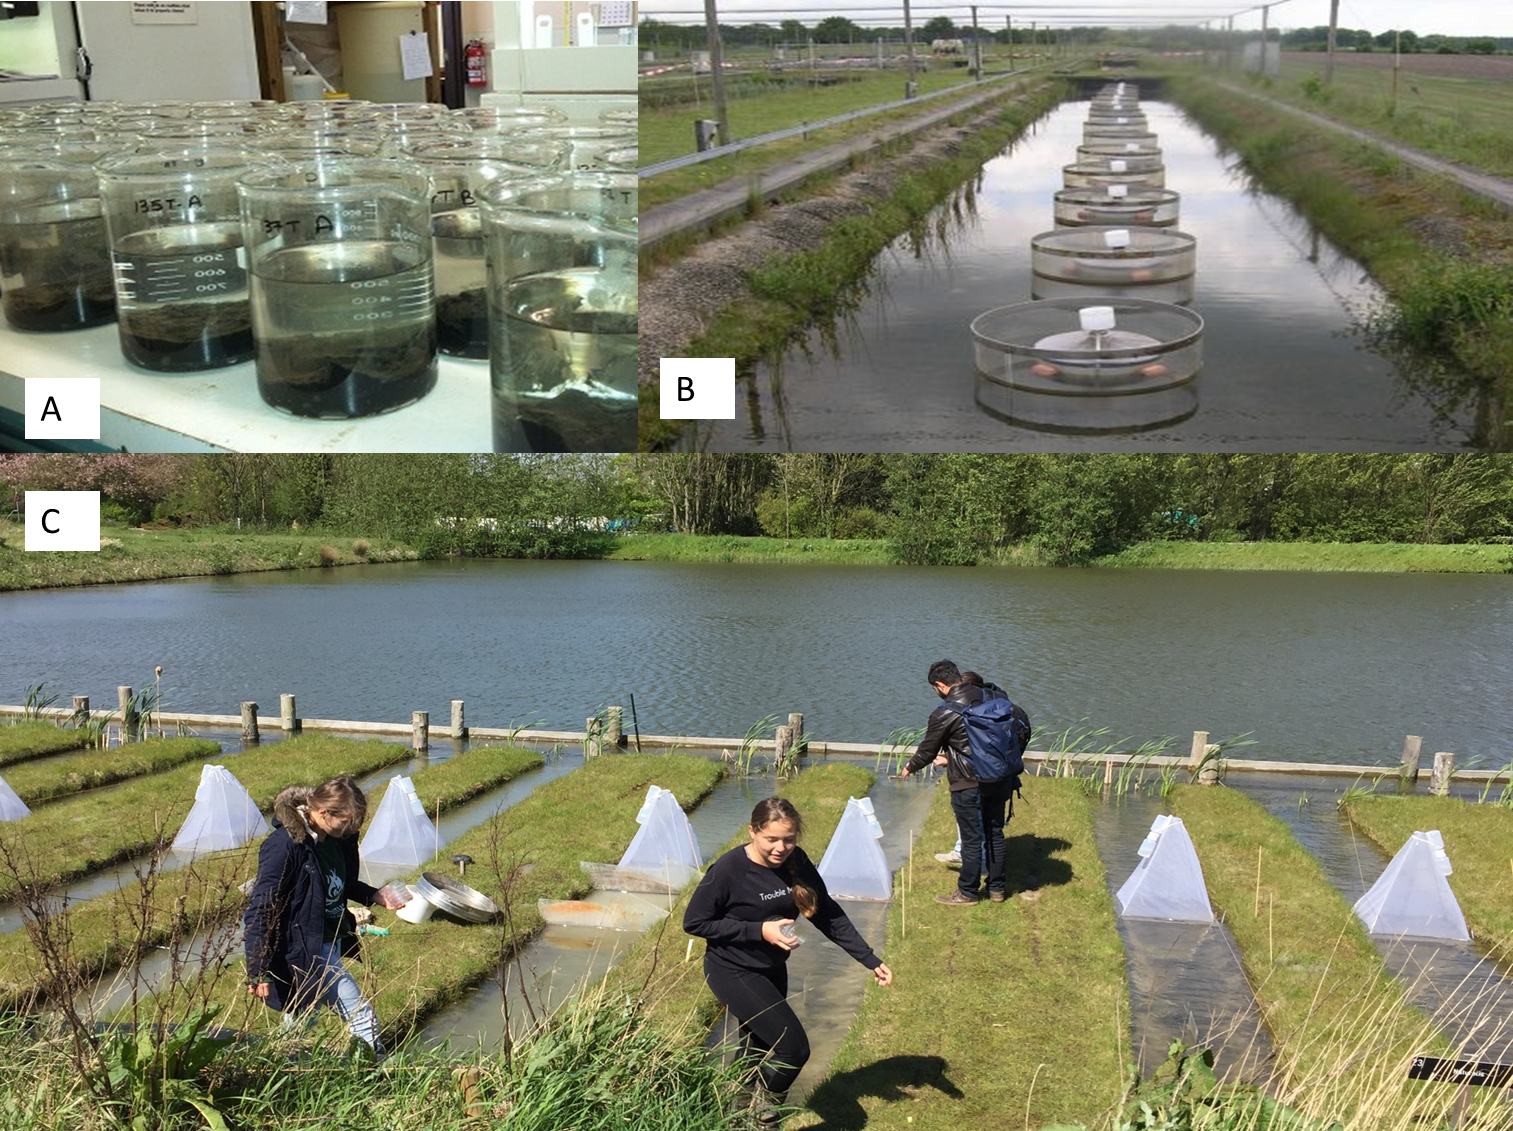
Microcosm or mesocosm (or cosm) studies represent a bridge between the laboratory and the natural world (examples of aquatic cosms are given in Figure 2). The difference between micro- and mesocosms is mostly restricted to size (Cooper and Barmuta, 1993). Aquatic microcosms are 10-3 to 10 m3 in size, while mesocosms are 10 to 104 m3 or even larger equivalent to whole or natural systems. The originality of cosms is mainly based on the combination of ecological realism, achieved by the introduction of the basic components of natural ecosystems, and facilitated access to a number of physicochemical, biological, and toxicological parameters that can be controlled to some extent. The cosm approach also makes it possible to work with treatments that can be replicated, so enabling the study of multiple environmental factors which can be manipulated. The system allows the establishment of food webs, the assessment of direct and indirect effects, and the evaluation of effects of contamination on multiple trophic and taxonomic levels in an ecologically relevant context. Cosm studies make it possible to assess effects of contaminants by looking at the parts (individuals, populations, communities) and the whole (ecosystems) simultaneously.


Figure 2. Different aquatic ecotoxicological testing facilities: A) indoor microcosms (water-sediment interface, at Leiden University), B) in situ (or caged) outdoor enclosures (at Wageningen Environmental Research), and C) cosms or experimental ditches (at Living Lab, Leiden University).


As given in the OECD guidance document (OECD, 2004), the size to be selected for a meso- or microcosm study will depend on the objectives of the study and the type of ecosystem that is to be simulated. In general, studies in smaller systems are more suitable for short-term studies of up to three to six months and studies with smaller organisms (e.g. planktonic species). Larger systems are more appropriate for long-term studies (e.g. 6 months or longer). Numerous ecosystem-level manipulations have been conducted since the early 1970s (Hurlbert et al., 1972). The Experimental Lakes Area (ELA) situated in Ontario, Canada deserves special attention because of its significant contributions to the understanding of how natural communities respond to chemical stressors. This ELA consists of 46 natural, relatively undisturbed lakes, which were designated specially for ecosystem-level research. Many different questions have been tackled here, e.g. manipulations with nutrients (amongst others Levine and Schindler, 1999), synthetic estrogens (e.g. Kidd et al., 2014) and Wallace with pesticides in the Coweeta district (Wallace et al., 1999). It is nowadays realized that there is a need for testing more than just individual species and to take into account ecosystem elements such as fluctuations of abiotic conditions and biotic interactions when trying to understand the ecological effects of chemicals. Therefore a selection of study parameters is often considered as given by OECD (2004):


  • Regarding treatment regime:
    • dosing regime, duration, frequency, loading rates, preparation of application
    • solutions, application of test substance, etc.;
    • meteorological records for outdoor cosms;
    • physicochemical water parameters (temperature, oxygen saturation, pH, etc.);


  • Regarding biological levels it should be recorded what sampling methods and taxonomic identification methods are used;
    • phytoplankton: chlorophyll-a; total cell density; abundance of individual dominant taxa; taxa (preferably species) richness, biomass;
    • periphyton: chlorophyll-a; total cell density; density of dominant species; species richness, biomass;
    • zooplankton: total density per unit volume; total density of dominant orders (Cladocera, Rotifera and Copepoda); species abundance; taxa richness, biomass;
    • macrophytes: biomass, species composition and % surface covering of individual plants;
    • emergent insects: total number emerging per unit of time; abundance of individual dominant taxa; taxa richness; biomass; density; life stages;
    • benthic macroinvertebrates: total density per unit area; species richness, abundance of individual dominant species; life stages;
    • fish: total biomass at test termination; individual fish weights and lengths for adults or marked juveniles; condition index; general behaviour; gross pathology; fecundity, if necessary.


Two typical examples of results obtained in an aquatic cosm study

A cosm approach assist in identifying and quantifying direct as well as indirect effects. Here two different types of responses are described, for more examples it is referred to the Section on Multistress.


Joint interactions: Barmentlo et al. (2018) used an outdoor mesocosm system consisting of 65 L ponds. Using a full factorial design, they investigated the population responses of macroinvertebrate species assemblages exposed for 35 days to environmentally relevant concentrations of three commonly used agrochemicals (imidacloprid, terbuthylazine, and NPK fertilizers). A detrivorous food chain as well as an algal-driven food chain were inoculated into the cosms. At environmentally realistic concentrations of binary mixtures, the species responses could be predicted based on concentration addition (see Section on Mixture toxicity). Overall, the effects of trinary mixtures were much more variable and counterintuitive. This was nicely illustrated by how the mayfly Cloeon dipterum reacted to the various combinations of the pesticides. Compared to single substance exposures and binary mixtures, extreme low recovery of C. dipterum (3.6% of control recovery for both mixtures) was seen. However, after exposure to the trinary mixture, recovery of C. dipterum no longer deviated from the control, and therefore was was higher than expected. Unexpected effects of the mixtures were also obtained for both zooplankton species (Daphnia magna and Cyclops sp.) As expected, the abundance of both zooplankton species was positively affected by nutrient applications, but pesticide addition did not lower their recovery. These type of unexpected results can only been identified when multiple species and multiple stressors are tested and cannot be detected in a lab-test with single species.


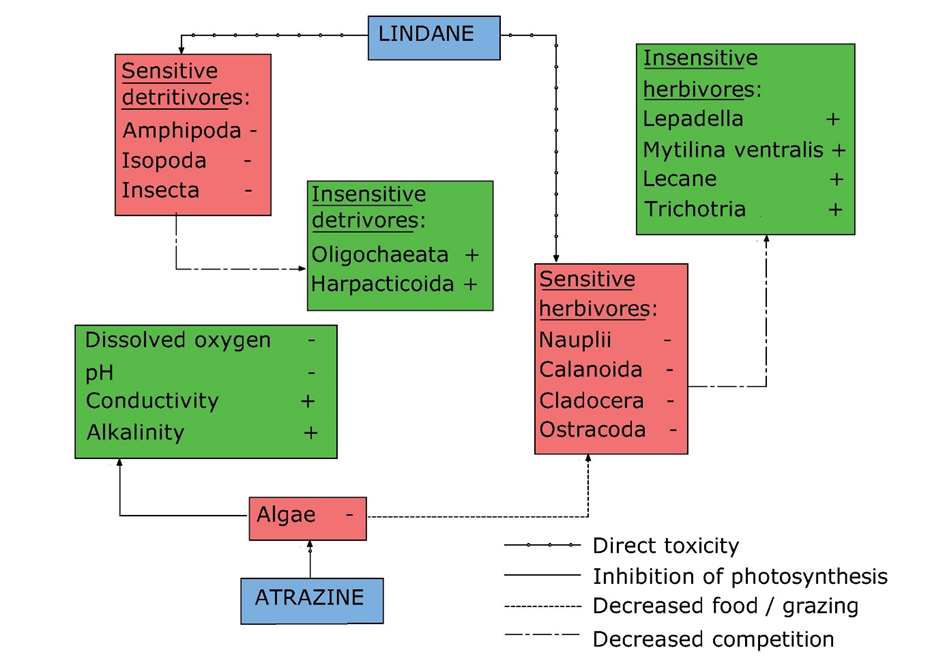
Indirect cascading effects: Van den Brink et al. (2009) studied the effects of chronic applications of a mixture of the herbicide atrazine and the insecticide lindane in indoor freshwater plankton-dominated microcosms. Both top-down and bottom-up regulation mechanisms of the species assemblage selected were affected by the pesticide mixture. Lindane exposure also caused a decrease in sensitive detritivorous macro-arthropods and herbivore arthropods. This allowed insensitive food competitors like worms, rotifers and snails to increase in abundance (although not always significantly). Atrazine inhibited algal growth and hence also affected the herbivores. A direct result of the inhibition of photosynthesis by atrazine exposure were lower dissolved oxygen and pH levels and an increase in alkalinity, nitrogen and electrical conductivity. See Figure 3 for a synthesis of all interactions observed in the study of Van den Brink et al. (2009).


Figure 3. Ecological effect chain as observed in a microcosm experiments using atrazine and lindane as stressors. The arrows indicate the hypothesis-driven relationships between species. The red colors (with -) represent negative feedbacks, the green colors (with +) positive feedbacks. See the text for further explanation. Adapted from Van den Brink et al. (2009) by Wilma IJzerman.


Realism of cosm studies

There is a conceptual conflict between realism and replicability when applied to mesocosms. Replicability may be achieved, in part, by a relative simplification of the system. The crucial point in designing a model system may not be to maximize the realism, but rather to make sure that ecologically relevant information can be obtained. Reliability of information on ecotoxicological effects of chemicals tested in mesocosms closely depends on the representativeness of biological processes or structures that are likely to be affected. This means that within cosms key features at both structural and functional levels should be preserved as they ensure ecological representativeness. Extrapolation from small experimental systems to the real world seems generally more problematic than the use of larger systems in which more complex interactions can be studied experimentally as well. For that reason, Caquet et al. (2000) claim that testing chemicals using mesocosms refines the classical methods of ecotoxicological risk assessment because they provide conditions for a better understanding of environmentally relevant effects of chemicals.


References

Barmentlo S.H., Schrama M., Hunting E.R., Heutink R., Van Bodegom P.M., De Snoo G.R., Vijver M.G. (2018). Assessing combined impacts of agrochemicals: Aquatic macroinvertebrate population responses in outdoor mesocosms, Science of the Total Environment 631-632, 341-347.

Caquet, T., Lagadic, L., Sheffield, S.R. (2000) Mesocosm in ecotoxicology: outdoor aquatic systems. Reviews of Environmental Contamination and Toxicology 165, 1-38.

Cairns Jr. J. (1983). Are single species toxicity tests alone adequate for estimating environmental hazard? Hydrobiologica 100, 47-57.

Cooper, S.D., Barmuta, L.A. (1993) Field experiments in biomonitoring. In Rosenberg, D.M., Resh, V.H. (Eds.) Freshwater Biomonitoring and Benthic Macroinvertebrates. Chapman and Hall, New York, pp. 399–441.

OECD (2004). Draft Guidance Document on Simulated Freshwater Lentic Field Tests (Outdoor Microcosms and Mesocosms) (July 2004). Organization for Economic Cooperation and Development, Paris. http://www.oecd.org/fr/securitechimique/essais/32612239.pdf

Hurlbert, S.H., Mulla, M.S., Willson, H.R. (1972) Effects of an organophosphorus insecticide on the phytoplankton, zooplankton, and insect populations of fresh-water ponds. Ecological Monographs 42, 269-299.

Kidd, K.A., Paterson, M.J., Rennie, M.D., Podemski, C.L., Findlay, D.L., Blanchfield, P.J., Liber, K. (2014). Direct and indirect responses of a freshwater food web to a potent synthetic oestrogen. Philosophical Transactions of the Royal Society B Biological Sciences 369, Article AR 20130578, DOI:10.1098/rstb.2013.0578

Landner, L., Blanck, H., Heyman, U., Lundgren, A., Notini, M., Rosemarin, A., Sundelin, B. (1989) Community Testing, Microcosm and Mesocosm Experiments: Ecotoxicological Tools with High Ecological Realism. Chemicals in the Aquatic Environment. Springer, pp. 216-254.

Levine, S.N., Schindler, D.W. (1999). Influence of nitrogen to phosphorus supply ratios and physicochemical conditions on cyanobacteria and phytoplankton species composition in the Experimental Lakes Area, Canada. Canadian Journal of Fisheries and Aquatic Sciences 56, 451-466.

Newman, M.C. (2008). Ecotoxicology: The History and Present Directions. In Jørgensen, S.E., Fath, B.D. (Eds.), Ecotoxicology. Vol. 2 of Encyclopedia of Ecology, 5 vols. Oxford: Elsevier, pp.1195-1201.

Van den Brink, P.J., Crum, S.J.H., Gylstra, R., Bransen, F., Cuppen, J.G.M., Brock, (2009). Effects of a herbicide – insecticide mixture in freshwater microcosms: risk assessment and ecological effect chain. Environmental Pollution 157, 237-249.

Wallace, J.B., Grubaugh, J.W., Whiles, M.R. (1996). Biotic indices and stream ecosystem processes: Results from an experimental study. Ecological Applications 6, 140-151.

5.8. Structure versus function incl. ecosystem services

Author: Herman Eijsackers

Reviewers: Nico van den Brink, Kees van Gestel, Lorraine Maltby


Learning objectives:

You should be able to

  • mention three levels of biodiversity
  • describe the difference between structural and functional properties of an ecosystem
  • explain why the functioning of an ecosystem generally tends to be less sensitive than its structure
  • describe the term Functional Redundancy and explain its meaning for interpreting effects on the structure and functioning of ecosystems


Keywords: structural biodiversity, functional biodiversity, functional redundancy, food web interactions


Biodiversity at three different levels

In ecology, biodiversity describes the richness of natural life at three levels: genetic diversity, species diversity (the most well-known) and landscape diversity. The most commonly used index, the Shannon Wiener index, expresses biodiversity in general terms as the number of species in relation to the number of individuals per species. Precisely, this index stands for the sum of the natural logarithm of the number of individuals per species present:


-∑(pi*ln(pi))


with pi = ni/N in which ni is the number of individuals of species i and N the total number of individuals of all species combined. The index is higher for communities with more species, but also higher when the abundance is more equally distributed over species. A low index implies a community with a few very dominant species. Environmental pollution tends to increase dominance, i.e. a few species are favoured and many become rare (see section on Community ecotoxicology).

In environmental toxicology, most attention is paid to species diversity. Genetic diversity plays a role in the assessment of more or less sensitive or resistant subspecies or local populations of a species, like in various mining areas with persistent pollution. Landscape diversity is receiving attention only recently and aims primarily at the total load of e.g. pesticides applied in an agronomic landscape (see Section on Landscape ecotoxicology), although it should more logically focus on the interactions between the various ecosystems in a landscape, for instance a lake surrounded partly by a forest, partly by a grassland.


Structural and functional diversity

In general, the various types of interactions between species do not play a major role in the study of biodiversity neither within ecology nor in environmental toxicology. The diversity in interactions described in the food web or food chain is not expressed in a term like the Shannon-Wiener index. However, in aquatic as well as soil ecological research, extensive, quantitative descriptions have been made of various ecosystems. These model descriptions, like the one for arable soil below, are partly based on the taxonomic background of species groups and partly on their functional role in the food web, expressed as their way of feeding (see for instance the phytophagous nematodes feeding from plants, the fungivorous nematodes eating fungi and the predaceous nematodes eating other nematodes).

The scheme in Figure 1 shows a very general soil food web and the different trophic levels. Much more detailed soil food web descriptions also are available, that do not only link the different trophic groups but also describe the energy flows within the system and through these flows the intensity and thus strength of the interactions that together determine the stability of the system (see e.g. de Ruiter et al., 1998).


Figure 1. Simplified soil food web showing the relationships between different organisms living in and on the soils and their trophic relationships. See text for further explanation. Source: https://en.wikipedia.org/wiki/Soil_food_web#/media/File:Soil_food_webUSDA.jpg


This food web shown in Figure 1 illustrates that biodiversity not only has a structural side: the various types of species, but also a functional one: which species are involved in the execution of which process. Various functional aspects are indicated in Figure 1, e.g. photosynthesis, decomposition, predation, grazing, etc. Often functions are related to the nutritional ecology of species or to their dealings with specific nutrients (carbon, nitrogen, etc.), but sometimes also to their behaviour (e.g. litter decomposition). At the species level this functional aspect has been further elaborated in specific feeding leagues. At the ecosystem level this functional aspect has clearly been recognized in the last decades and resulted in the development of the concept of ecosystem services (see Section on Ecosystem services). However, these do not trace back to the individual species level and as such not to the functional aspect of biodiversity. Another development to be mentioned is that of trait-based approaches, which attempt to group species according to certain traits that are linked not only to exposure and sensitivity but also to their functioning. With that the trait-based approach may enable linking structural and functional biodiversity (see Section on Trait-based approaches).


Functional redundancy

When effects of contaminants on species are compared to effects on processes, the species effects are mostly more distinct than the process effects. In other words: effects on structural diversity will be seen already at lower concentrations, and probably also sooner, than effects on functional diversity. This can be explained by the fact that processes are executed by more than one species. When with increasing chemical exposure levels the most sensitive species disappear, their role is taken over by less sensitive species. This reasoning has been generalized in the concept of “functional redundancy”, which postulates that not all species that can perform a specific process are always active, and thus necessary, in a specific situation. Consequently some of them are “superfluous” or redundant. When a sensitive species that can perform a similar function disappears, a redundant species may take over, so the function is still covered. It has to be realized, however, that in case this is relevant in situation A, that does not mean it is also relevant for situation B with different environmental conditions and another species composition. Another consequence of functional redundancy is that when functional biodiversity is affected, there is (severe) damage to structural biodiversity: most likely several important species will have gone extinct or are strongly inhibited.

The degree of functional redundancy in an ecosystem is not easily measured. In general one may assume that the rate of ecosystem processes will increase with increasing species diversity. If such a relationship shows a curve levelling-off towards a ceiling, this represents a clear case of redundancy (Figure 2, top left graph). However, the relationship may take all kind of different forms. If ecosystem rates depend on keystone species, there may be discontinuities in the curve, related to the demise of these specific species. Figure 2 shows various theoretical shapes of the curves.


Figure 2. Six possible relationships between ecosystem process rate and species diversity in a community, slightly modified from Naeem et al. (2002).


Examples of the relation between structure and functioning

Redundant species are often less efficient in performing a certain function. Tyler (1984) studied a gradient of soil copper contamination by a copper manufacturing plant in Gusum, Sweden. He observed that specific enzyme functions as well as general processes like mineralisation decreased faster than the total fungal biomass, with decreasing distance from the plant. (Figure 3b). The explanation was provided in subsequent experimental research (Rühling et al., 1984). A number of micro-fungi were isolated from the field and tested for their sensitivity to copper. The various species showed different concentration-effect relationships but all going to zero, except for two species which increased in abundance at the higher concentration so that the total biomass stayed more or less the same (Figure 3a).


Figure 3. Left: Experimental dose responses of various microfungi species to increased levels of copper in the organic matter used as substrate and the total response for all tested species (Rühling et al., 1984). Right: Reduction of various breakdown processes and fungal biomass in the field with increasing copper levels in the soil (Tyler, 1984). Drawn by Wilma IJzerman.


Another example of the importance of a combined approach to structural and functional diversity are the different ecological types of earthworms. According to their behaviour and role they are classified as:

  • anecics (deep burrowing earthworms moving up and down from deeper soil layers to the soil surface and consuming leaf litter),
  • endogeics (active in the deeper laying mineral and humus soil layers and consuming fragmented litter material and humus), and
  • epigeics (active in the upper soil litter layer and consuming leaf litter).

Adverse effects of contamination on the anecics will result in accumulation of litter at the soil surface, in reduced litter fragmentation by the epigeics and reduced humus-forming by the endogeics. In various studies it has been shown that these earthworms have different sensitivities for different types of pesticides. However, so far the ranking of more or less sensitive species is different for different groups of pesticides. So, there is no general relation between the function of a species e.g. surface active earthworms (epigeics) and their exposure to and sensitivity for pesticides. Nevertheless, pesticide effects on anecics generally lead to reduced litter removal, effects on endogeics result in slower fragmentation, reduced humification etc., and an effect on earthworm communities in general may hamper soil aeration and lead to soil compaction.


Another example of the impact of contaminants on functional diversity is from microbiological research on the impact of heavy metals by Doelman et al. (1994). They isolated fungi and bacteria from various heavy metal contaminated and clean areas, tested these species for their sensitivity to zinc and cadmium, and divided them accordingly in a sensitive and resistant group. As a next step they measured to what extent both groups were able to degrade and mineralize a series of organic compounds. Figure 4 shows that the sensitive group is much more effective in degrading a variety of organic compounds, whereas the heavy metal resistant microbes are far less effective. This would indicate that although functional redundancy may alleviate some of the effects that contaminants have on ecosystem functioning, the overall performance of the community generally decreases upon contaminant exposure.


Figure 3. Decomposing capacity (measured as growth) of Zn resistant bacteria and Zn sensitive bacteria for increasing numbers of organic compounds. Redrawn from Doelman et al. (1994) by Wilma Ijzerman.


The latter example also shows that genetic diversity, expressed as the numbers of sensitive and resistant species, plays a role in the functional stability and sustainability of microbial degradation processes in the soil.


In conclusion, ecosystem services are worth studying in relation to contamination (Faber et al., 2019), but also more specific in relation to functional diversity at the species level. A promising field of research in this framework would include microorganisms in relation to the variety of degradation processes they are involved in.


References

De Ruiter, J.C., Neutel, A-M., Moore, J.C. 1995. Energetics, patterns of interaction strenghts and stability in real ecosystems. Science 269, 1257-60.

Doelman, P., Jansen, E., Michels, M., Van Til, M. (1994). Effects of heavy metals in soil on microbial diversity and activity as shown by the sensitivity-resistance index, an ecologically relevant parameter Biology and Fertility of Soils 17, 177-184.

Faber, J.H., Marshall, S., Van den Brink, P.J., Maltby, L. (2019). Priorities and opportunities in the application of the ecosystem services concept in risk assessment for chemicals in the environment. Science of the Total Environment 651, 1067-1077.

Naeem, S., Loreau, M., Inchausti, P. (2002). Biodiversity and ecosystem functioning: the emergence of a synthetic ecological framework. In: Loreau, M., Naeem, S., Inchausti, P. (Editors). Biodiversity and Ecosystem Functioning. Oxford University Press, Oxford, pp. 3-11.

Rühling, Å., Bååth, E., Nordergren, A., Söderström, B. (1984) Fungi in a metal-contaminated soil near the Gusum brass mill, Sweden. Ambio 13, 34-36.

Tyler, G. (1984) The impact of heavy metal pollution on forests: A case study of Gusum, Sweden. Ambio 13, 18-24.

5.9. Landscape ecotoxicology

In preparation

  • Het arrangement 5. Population, Community and Ecosystem Ecotoxicology is gemaakt met Wikiwijs van Kennisnet. Wikiwijs is hét onderwijsplatform waar je leermiddelen zoekt, maakt en deelt.

    Laatst gewijzigd
    2021-03-08 14:40:26
    Licentie
    CC Naamsvermelding 4.0 Internationale licentie

    Dit lesmateriaal is gepubliceerd onder de Creative Commons Naamsvermelding 4.0 Internationale licentie. Dit houdt in dat je onder de voorwaarde van naamsvermelding vrij bent om:

    • het werk te delen - te kopiëren, te verspreiden en door te geven via elk medium of bestandsformaat
    • het werk te bewerken - te remixen, te veranderen en afgeleide werken te maken
    • voor alle doeleinden, inclusief commerciële doeleinden.

    Meer informatie over de CC Naamsvermelding 4.0 Internationale licentie.

    Aanvullende informatie over dit lesmateriaal

    Van dit lesmateriaal is de volgende aanvullende informatie beschikbaar:

    Eindgebruiker
    leerling/student
    Moeilijkheidsgraad
    gemiddeld